Figures & data
Figure 1 Study flow diagram.
Abbreviations: NCS, nerve conduction study, PGIC, patient global impression of change.
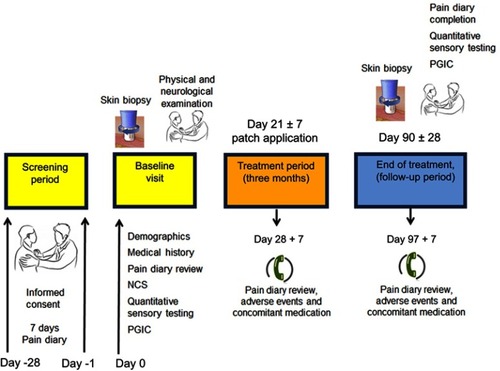
Table 1 Patients’ demographics and clinical characteristics
Table 2 Results before and after capsaicin 8% patch: spontaneous pain (NPRS), short form McGill pain questionnaire, patient global impression of change, quantitative sensory testing, and contact heat evoked potentials
Figure 2 Immunohistochemistry in skin biopsies for PGP9.5, before and after capsaicin 8% patch treatment. Intra-epidermal nerve fibers (arrowed) and sub-epidermal nerve fibers from (A) control subjects, at the baseline visit (B, Q PRE) and, after capsaicin 8% patch treatment (C, Q POST), magnification x40. (D) Bar chart of intra-epidermal nerve fibers for PGP 9.5 counts, (E) bar chart of sub-epidermal (SENF) analysis (% area).
Notes: *Significant; **very significant.
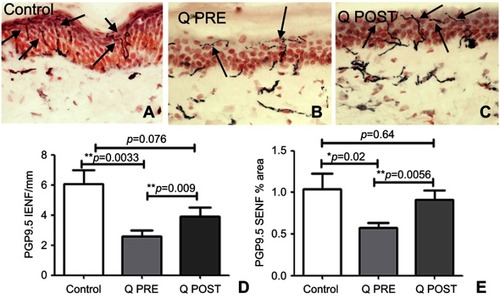
Figure 3 Immunohistochemistry in skin biopsies for TRPV1, before and after capsaicin 8% patch treatment. Intra-epidermal nerve fibers (arrowed) and sub-epidermal nerve fibers from (A) control subjects, at the baseline visit (B, Q PRE) and, after capsaicin 8% patch treatment (C, Q POST), magnification x40. (D) Bar chart of intra-epidermal nerve fibers for TRPV1 (IENF) counts; (E) bar chart of sub-epidermal (SENF) analysis (% area) for TRPV1.
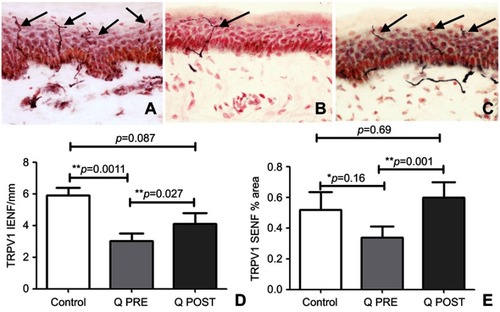
Figure 4 Immunohistochemistry in skin biopsies for SNSR, before and after capsaicin 8% patch treatment. Intra-epidermal nerve fibers (arrowed) and sub-epidermal nerve fibers from (A) control subjects, at the baseline visit (B, Q PRE) and, after capsaicin 8% patch treatment (C, Q POST), magnification x40. (D) Bar chart of intra-epidermal nerve fibers for SNSR (IENF) counts; (E) bar chart of sub-epidermal (SENF) analysis (% area) for SNSR.
Note: *Significant.
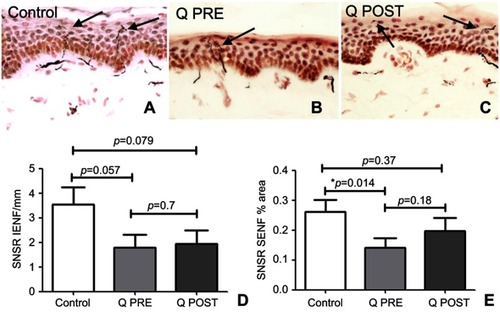
Figure 5 Immunohistochemistry in skin biopsies for GAP43, before and after capsaicin 8% patch treatment. Representative image of intra-epidermal nerve fibers (arrowed) and sub-epidermal nerve fibers from (A) control subjects, at the baseline visit (B, Q PRE) and, after capsaicin 8% patch treatment (C, Q POST), magnification x40. (D) Bar chart of intra-epidermal nerve fibers for GAP43 (IENF) counts; (E) bar charts of sub-epidermal (SENF) analysis (% area) for GAP43.
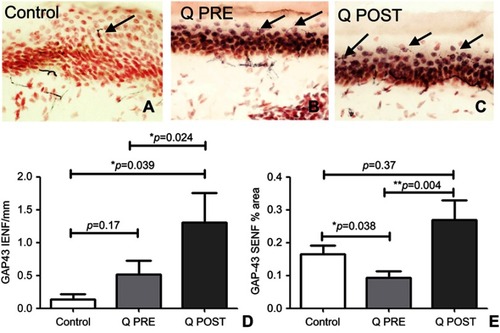
Figure 6 Immunohistochemistry in skin biopsies for NGF, before and after capsaicin 8% patch treatment. NGF immunostaining of basal epidermis in calf skin obtained from (A) control subjects, and CIPN patients before (B, Q PRE) and after capsaicin 8% patch treatment (C, Q POST), magnification x40. (D) Bar chart showing the basal cell NGF image analysis (% area).
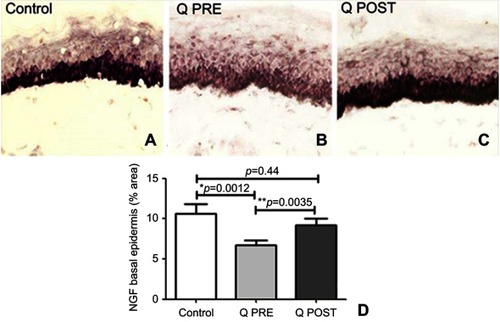
Figure 7 Immunohistochemistry in skin biopsies for NT3, before and after capsaicin 8% patch treatment. NT3 immunostaining from (A) control subjects, and CIPN patients before (B, Q PRE) and after capsaicin 8% patch treatment (C, Q POST). (D) Bar chart showing NT3 suprabasal image analysis (% area).
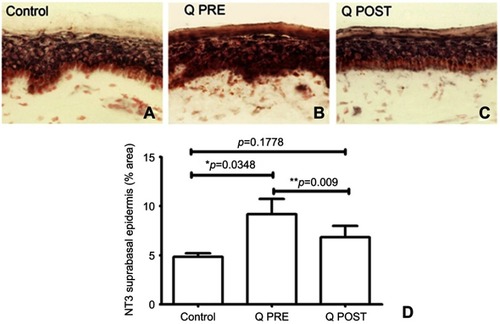
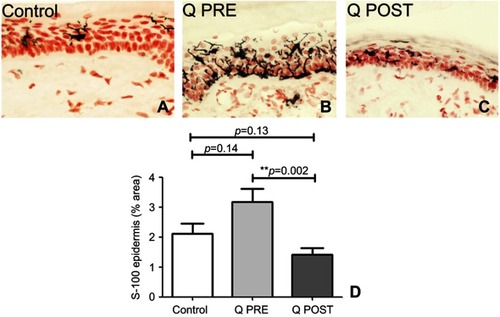
Figure 8 Immunohistochemistry in skin biopsies for Langerhans cells (LCs), before and after capsaicin 8% patch treatment. LCs immunostaining in the epidermis of calf skin from (A) control subjects, and CIPN patients before (B, Q PRE) and after capsaicin 8% patch treatment (C, Q POST), magnification x40. (D) Bar chart showing LCs image analysis (% area).
Note: **Very significant.