Figures & data
Figure 1 Ultrasound-Guided Injection Practice.
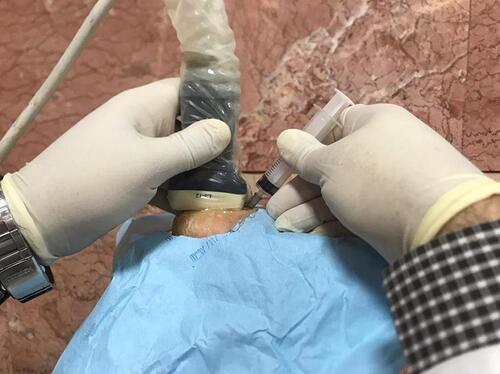
Figure 2 The Consolidated Standards of Reporting Trials (CONSORT) diagram of the current study.
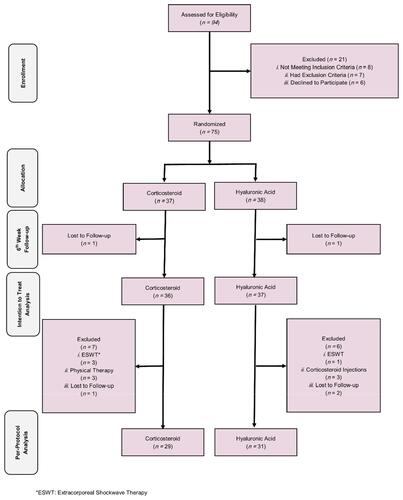
Table 1 Baseline Characteristics of the Participants in the Groups
Table 2 Within Group Analysis of Outcomes Over the Time
Table 3 Between Group Analysis of Outcomes Over the Time
Table 4 Comparing the Success Rate Between Groups Over the Time
Figure 3 The visual analog scale (VAS) trend of changes in the hyaluronic acid (HA) and corticosteroid injection (CS) groups.
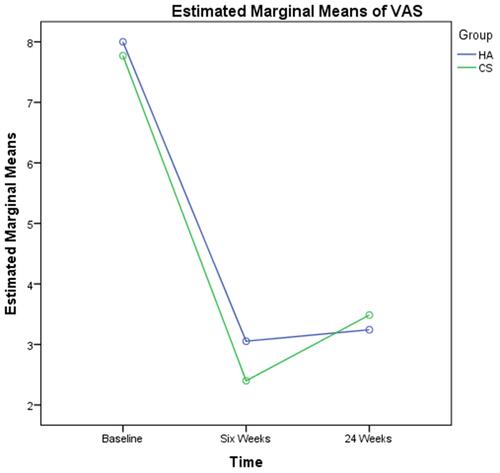
Figure 4 The pressure pain threshold (PPT) trend of changes in the hyaluronic acid (HA) and corticosteroid injection (CS) groups.

Figure 5 The ultrasonographic ultrasonography thickness values (USV) trend of changes in plantar fascia in the hyaluronic acid (HA) and corticosteroid injection (CS) groups.
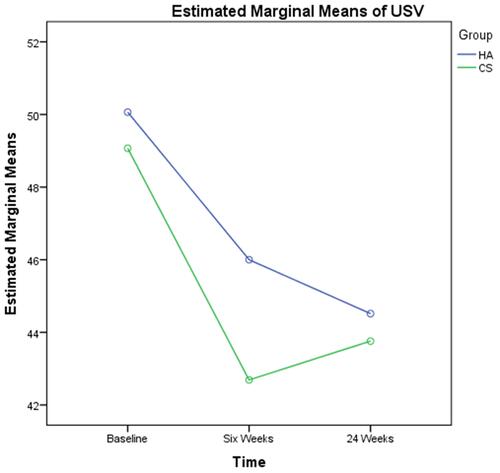
Figure 6 The functional foot index (FFI) trend of changes in the hyaluronic acid (HA) and corticosteroid injection (CS) groups.
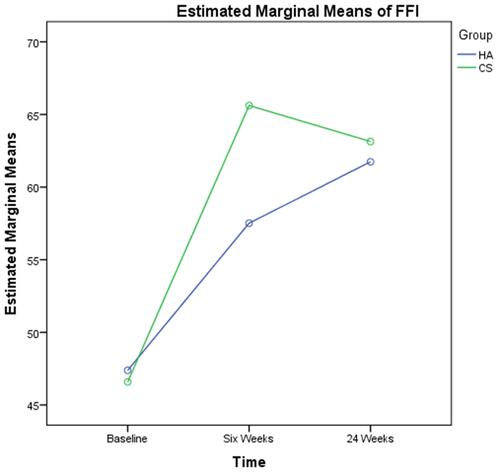
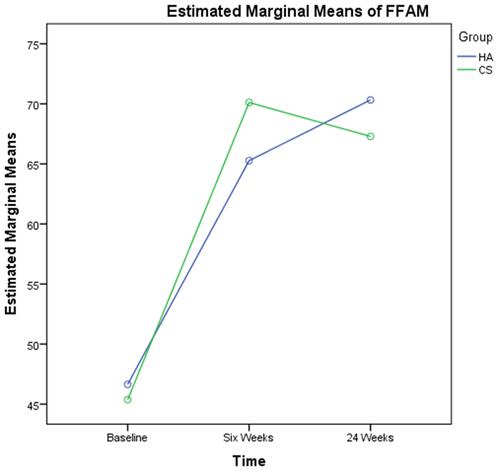
Figure 7 The foot and ankle ability measure (FFAM) trend of changes in the hyaluronic acid (HA) and corticosteroid injection (CS) groups.