Figures & data
Table 1 Characteristics of diabetic neuropathy patients
Table 2 Comparison of clinical data of painful DN (cases) and painless DN (controls)
Figure 1 Scatter plots illustrating plasma TNF-α levels, iNOS and TNF-α expression in patients with Painless DN (n = 51), mild PDN (n = 34) and severe PDN (n = 25). The short horizontal line marks median values. (A) Patients with severe PDN had higher plasma TNF-α levels than patients with mild PDN (P < 0.001) and Painless DN (P < 0.001) (B) Patients with severe PDN had higher iNOS expression than patients with mild PDN (P < 0.001) and Painless DN (P < 0.001). (C) Patients with severe PDN had higher plasma TNF-α levels than patients with mild PDN (P < 0.001) and Painless DN (P < 0.001). In patients with PDN plasma TNF-α levels were 1.4 (P < 0.05), iNOS expression was 2.1 (P < 0.05), and TNF-α expression were 1.98 (P < 0.05) fold higher than in Painless DN.
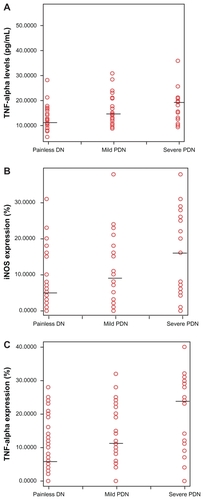
Table 3 Correlation between pain intensity and some risk factors of painful diabetic neuropathy
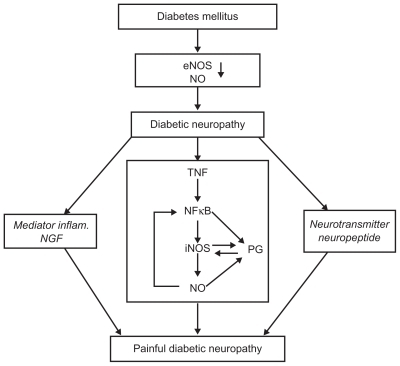
Figure 2 Pathophysiological relationship between TNF-α, iNOS, and painful diabetic neuropathy.