Figures & data
Figure 1 CCI of sciatic nerve induces mechanical and thermal hypersensitivity. Paw mechanical withdrawal thresholds (A) and thermal withdrawal latency (B) were assessed with electronic Von Frey and plantar test analgesia meter, respectively, on ipsilateral hind paws of CCI and sham-operated rats. n = 6 in both groups. All data were represented as mean ± SD. Statistical analyses consisted of repeated measures two-way ANOVA tests followed by Sidak’s multiple comparisons tests. ****P < 0.0001 between Sham and CCI groups.
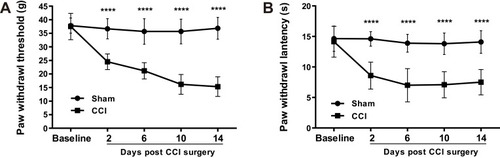
Table 1 Differentially Expressed microRNAs Between Sham-Operated And CCI Rats
Table 2 Differentially Expressed lncRNAs Between Sham-Operated And CCI Rats
Figure 2 mRNA expression between the CCI and sham-operated rats. (A) Hierarchical clustering shows a differential mRNA expression profiles between two groups. The upregulated mRNAs in the CCI group are shown in red, and the downregulated ones are in green. (B) Box plots show the distribution of mRNAs for the two groups. The distributions (the means, the 25th and 75th percentiles) were nearly the same in the CCI and Sham groups after normalization, indicating that the overall expression of mRNA was uniform between the two groups. (C) Scatter plots assess the mRNA expression differences between CCI and Sham groups. The mRNAs above the top green line (indicated with red dot) and below the bottom green line (indicated with green dot) are differential mRNAs (fold change ≥ 2.0 or ≤ −2.0, respectively), while mRNAs with no expression difference are represented with black dots between the two border lines.
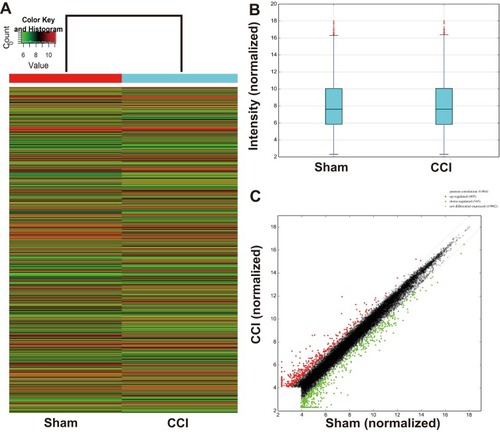
Table 3 Differentially Expressed mRNAs Between Sham-Operated And CCI Rats
Figure 3 Gene ontology enrichment analysis. Enriched gene ontology (GO) terms correspond to the 405 differentially upregulated (A-C) mRNAs and 545 downregulated (D-F) mRNAs in CCI group. (A, D) Top 10 significantly (Sig) enriched biological processes (BP) terms for the upregulated and downregulated differentially expressed (DE) mRNAs in CCI group, respectively. (B, E) Top 10 enriched cellular component (CC) terms for the upregulated and downregulated DE mRNAs in CCI group, respectively. (C, F) Top 10 enriched molecular function (MF) terms for the upregulated and downregulated DE mRNAs in CCI group, respectively.
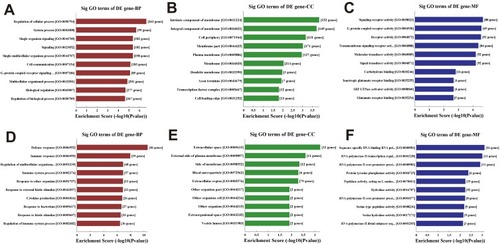
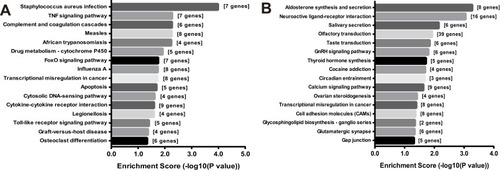
Figure 4 KEGG pathways significantly enriched by differentially expressed mRNAs. (A) Pathways significantly enriched (P < 0.05) by the upregulated mRNAs in CCI group. (B) KEGG pathways significantly enriched (P < 0.05) by the downregulated mRNAs in CCI group.