Figures & data
Figure 1 Diagram of the experimental protocol. After the installation surgery of IS the injection seat and recovery 7 days later, over the next 3 days, each rat underwent prophylactic electroacupuncture, and IS injection in turn. The electrophysiological recordings were performed at the end of the above operation on the third day, followed by the sacrifice of rats, removing the medulla tissue and pathological sections. The behavioral testing proceeded until the rats were sacrificed.
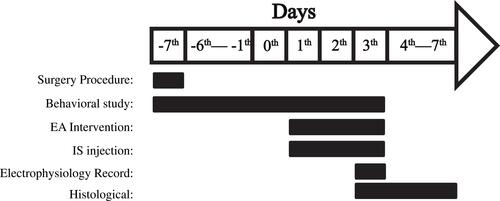
Figure 2 Testing mode and result diagram of the cutaneous receptive field pain threshold. The gray oval area (V) between the eye and ear in the behavioral test mode (A) is the periorbital region receptive field of trigeminal nerve. The left and right mechanical pain threshold with Day 0 to Day 3 is performed as line chart (B). Compares with M (C:P=0.001, 0.010, 0.004; EA:P=0.061, 0.034, 0.048; NA:P=1.00, 1.00, 1.00; SEA:P=0.003, 0.054, 0.047; SNA:P=0.011, 0.004, 0.005 successively in left on Days 1–3. (C) P<0.001, P=0.003, 0.002; EA:P=0.21, 0.081, 0.009; NA:P=1.00, 1.00, 1.00; SEA:P=0.003, 0.005, 0.006; SNA:P=0.002, 0.015, 0.033 successively in right on Days 1–3); Comparing with EA (C:P=1.00, 1.00, 1.00; NA:P=0.074, 0.11, 0.051; SEA: P=1.00, 1.00, 1.00; SNA: P=1.00, 1.00, 1.00 successively in left on Days 1–3, (C) P=0.36, 1.00, 1.00; NA:P=0.44, 0.14, 0.061; SEA: P=0.319, 1.00, 1.00; SNA: P=0.245, 1.00, 1.00 successively in right on Days 1–3); Compares with NA (C:P=0.002, 0.038, 0.005; SEA: P=0.003, 0.213, 0.054; SNA: P=0.013, 0.020, 0.006 successively in left on Days 1–3, (C) P=0.001, 0.006, 0.020; SEA: P=0.007, 0.012, 0.039; SNA: P=0.005, 0.032, 0.166 successively in right on Days 1–3); There were no statistical significance between groups C, SEA, and SNA in left or right on Days 1–3; There were no statistical significance between groups M and NA in left or right on Days 1–3. And the P value between each groups of Day 0 in left and right is, respectively, 0.37 and 0.86. The comparison between the left and right side of the cutaneous receptive field pain threshold (C) shows no significance in any group and days. The white column represents the left side of the cutaneous receptive field pain threshold while the black column indicates the right side. All the P values have been signed. N=7/group.
Abbreviations: C, control group; M, model group; EA, electroacupuncture group; NA, non-acupoint electroacupuncture group; SEA, saline+electroacupuncture group; SNA, saline+non-acupoint electroacupuncture group.
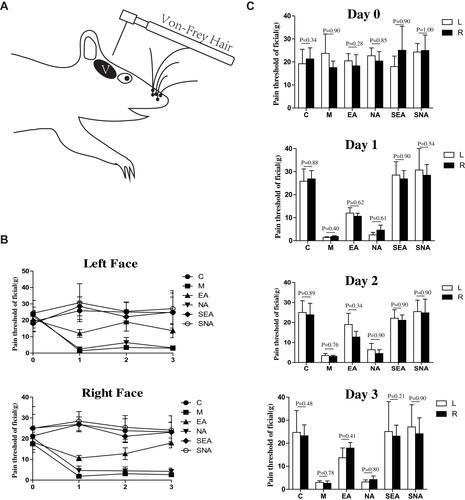
Figure 3 (A) Pattern diagram of EA intervention, dural IS injection, electrophysiological recording in the TCC area and high and low-intensity stimuli. (B) An original tracing from a typical unit responding to stimulation of a receptive field (latencies in the Aδ-fiber range). Black arrow represents stimulus artefact. (C) A pathological diagram of an electrophysiological recording area in TCC section. The arrow refers to the electrical area of damage, corresponding to the recording electrode’s pinpoint location. (D) The collection diagram of TCC electrophysiological recording sites. Black dots represent control group, red dots represent model group, green dots represent EA group, blue dots represent NA group, yellow dots represent SEA group, and gray dots represent SNA group.
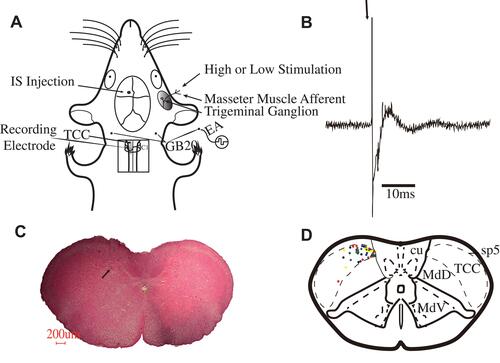
Figure 4 Base discharge rate diagram of TCC in migraine rats. (A) Basic discharge oscillogram and average of discharges per 5 s histogram for each groups. (B) Histogram for average discharges/s (Hz). #P<0.05 compares with M (C:P=0.004; EA:P=0.009; SEA:P=0.007; SNA:P=0.011); *P<0.05 compares with NA (C:P=0.007; EA:P=0.014; SEA: P=0.013; SNA: P=0.019); There was no statistical significance between groups C, EA, SEA, and SNA. There was no statistical significance between groups M and NA. N=7/group.
Abbreviations: C, control group; M, model group; EA, electroacupuncture group; NA, non-acupoint electroacupuncture group; SEA, saline+electroacupuncture group; SNA, Saline+non-acupoint electroacupuncture group.
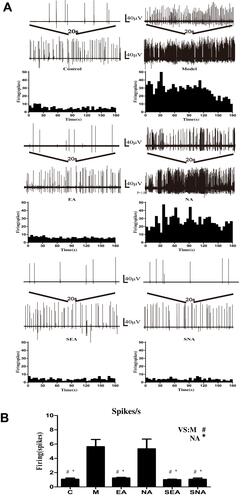
Figure 5 (A) Electrophysiological waveform diagram of the TCC area stimulated by high- and low-intensity stimulation in the trigeminal nerve receptive field. The red and green triangles refer to the points of time at which the weak or strong stimuli are implemented instantaneously. The duration of each waveform was 40 s. (B) The diagram of average discharge per second of the non-, low-, high-stimulating periods. The white, black and gray columns represent the non-, low-, high-stimulating periods. All the P values have been signed; N=7/group.
Abbreviations: C, control group; M, model group; EA, electroacupuncture group; NA, non-acupoint electroacupuncture group; SEA, saline+electroacupuncture group; SNA, saline+non-acupoint electroacupuncture group.

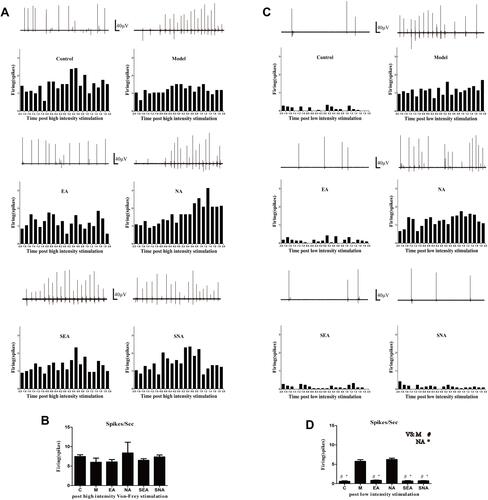
Figure 6 Instantaneous discharge diagram of a TCC neuron stimulated by a high-intensity stimulation. (A) Discharges wave chart of 2 s before and after the moment of strong stimulation. The 0.0 of the abscissa means the moment that the stimulus was implemented. (B) Average discharge times/0.2 s in 2 s before and after the moment of high-intensity stimulation Grouping and quantity of each group are the same as . There was no statistical significance between each group. (C) Instantaneous discharge diagram of a TCC neuron stimulated by a low-intensity stimulation. (A) Discharges wave chart of 2 s before and after the moment of weak stimulation. The 0.0 of the abscissa means the moment that the stimulus was implemented. (D) Average discharge times/0.2 s in 2 s before and after the moment of low-intensity stimulation. #P<0.05 compares with M (C:P=0.004; EA:P=0.013; SEA:P=0.017; SNA:P=0.044); *P<0.05 compares with NA (C:P=0.001; EA:P=0.006; SEA: P=0.006; SNA: P=0.018); There was no statistical significance between groups C, EA, SEA, and SNA. There was no statistical significance between groups M and NA. N=7/group.
Abbreviations: C, control group; M, model group; EA, electroacupuncture group; NA, non-acupoint electroacupuncture group; SEA, saline+electroacupuncture group; SNA, saline+non-acupoint electroacupuncture group.