Figures & data
Figure 1 CONSORT flow diagram.
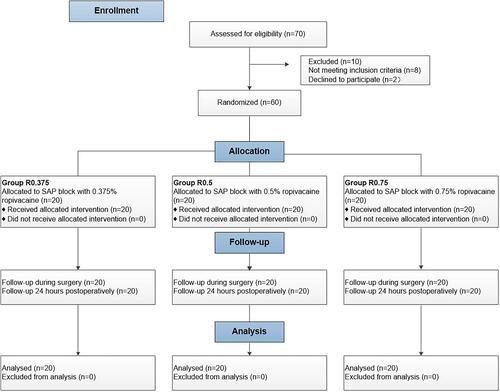
Figure 2 Ultrasonogram of serratus anterior plane block.
Abbreviations: LD, latissimus dorsi muscle; SA, serratus anterior; LAs, local anesthetics; R4, the fourth rib; R5, the fifth rib.
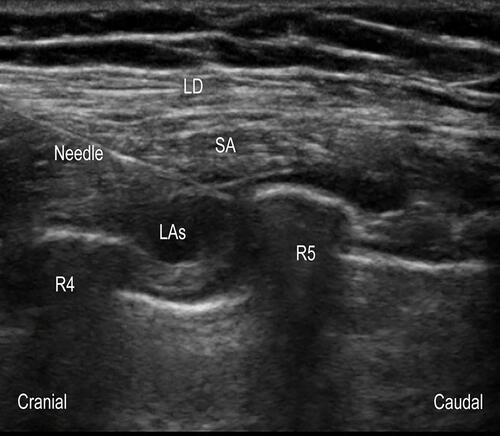
Table 1 Demographic and Intraoperative Characteristics
Figure 3 (A) AUC of NRS pain intensity scores at rest through 24 h postsurgery; (B) AUC of NRS pain intensity scores on movement through 24 h postsurgery. (C) NRS score (ranging from 0 to 10) for pain at rest; (D) NRS score (ranging from 0 to 10) for pain on movement. Values are mean (standard deviation) or median (interquartile range), n=20. R0.375: 0.375% ropivacaine with 20mL volume; R0.5: 0.5% ropivacaine with 20mL volume; R0.75: 0.75% ropivacaine with 20mL volume. #P<0.05 indicates a significant difference in comparison to Group R0.375. *P<0.017 indicates a significant difference in comparison to Group R0.375.
Abbreviation: NRS, numerical rating scale.
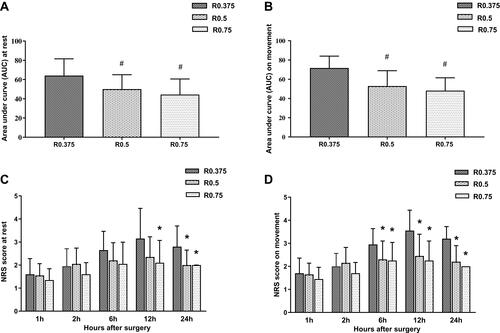
Figure 4 (A) the worst pain scores (ranging from 0 to 10); (B) the incidence of moderate-severe pain (NRS>3). Values are median (interquartile range) or percentage, n=20. R0.375: 0.375% ropivacaine with 20mL volume; R0.5: 0.5% ropivacaine with 20mL volume; R0.75: 0.75% ropivacaine with 20mL volume. *P<0.017 indicates a significant difference in comparison to Group R0.375.
Abbreviation: NRS, numerical rating scale.
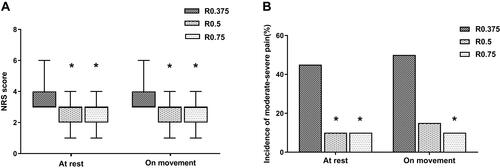
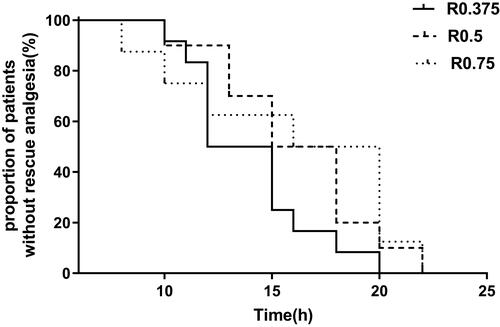
Figure 5 The time of first need for tramadol. Kaplan-Meier survival curves demonstrated that the time between completion of surgery and the first administration of rescue analgesia. R0.375: 0.375% ropivacaine with 20mL volume; R0.5: 0.5% ropivacaine with 20mL volume; R0.75: 0.75% ropivacaine with 20mL volume. There was no significant difference among the three groups, P =0.180.