
Figures & data
Table 1 Composition Of E-OA-07
Figure 1 Participants Flow In The Study.
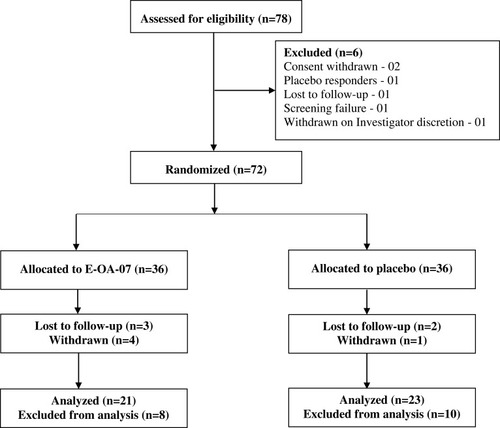
Table 2 Participants Demographics And Baseline Characteristics
Figure 2 Changes in WOMAC subscale mean score (A) pain, (B) stiffness, (C) physical function, and (D) total WOMAC. Data are represented as Mean ± SD. *p<0.05 and **p<0.001.
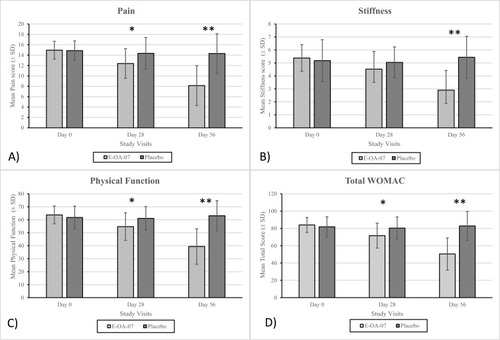
Table 3 Visit Wise Scores Of WOMAC Pain, Stiffness, Physical Function And Total WOMAC Scores
Table 4 Change In WOMAC Subscale Of Pain, Stiffness, Physical Function And Total WOMAC Scores
Figure 3 Quality-of-life score response to placebo and E-OA-07 therapy. Significant improvement was observed in each of the domains: mobility, self-care, daily activities, pain/discomfort, and anxiety/depression. *p <0.001.
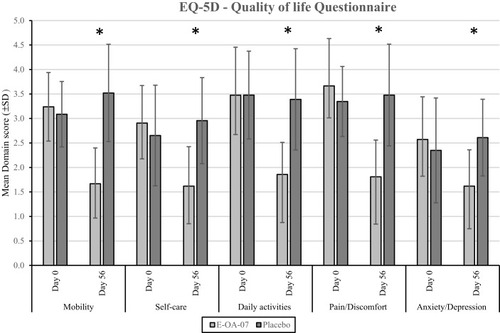
Table 5 Effect Of E-OA-07 And Placebo On EQ-5D-5L Scores
Table 6 SAT Scores Evaluated At The End Of Study Period (Day 56)
Table 7 Vital Signs
Table 8 Hematological And Biochemical Parameters