
Figures & data
Figure 1 Flow chart of inclusion of trigeminal neuralgia patients.
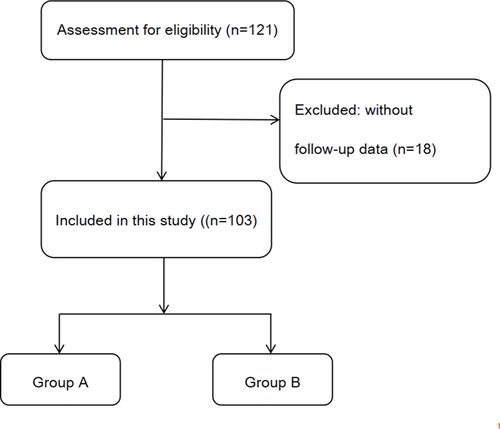
Figure 2 C-arm X-ray scans were performed to confirm the correct localization .
Notes: (A) C-arm image showing the trajectory of the needle after insertion. (B) C-arm scan showed that the tip of the trocar was located around foramen ovale. “a” was the point of the needle, “b” was the tail of the needle, and the arrow was the foramen ovale.
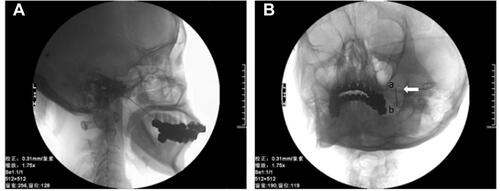
Table 1 Patient Demographics and Clinical Data
Table 2 Barrow Neurological Institute (BNI) Pain Intensity Scale
Figure 3 Details of the BNI score.
Notes: (A) Bar chart showing the BNI score at follow-up in patients with total trigeminal neuralgia. (B) Bar chart showing the BNI score at follow-up in patients with classical trigeminal neuralgia. (C) Bar chart showing the BNI score at follow-up in patients with post-herpetic trigeminal neuralgia.
Abbreviation: BNI, Barrow Neurological Institute.
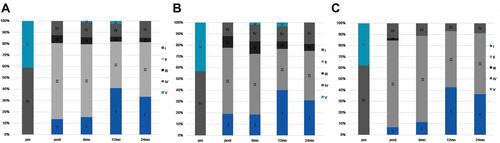
Figure 4 Changes in VAS.
Notes: There was a significant decrease in pain intensity after the ozone injection in both groups (*P < 0.05), and this was even maintained for up to 24 months of the follow-up. No difference was found in the follow-up VAS scores between two groups (P > 0.05).
Abbreviation: VAS, visual analog scale.
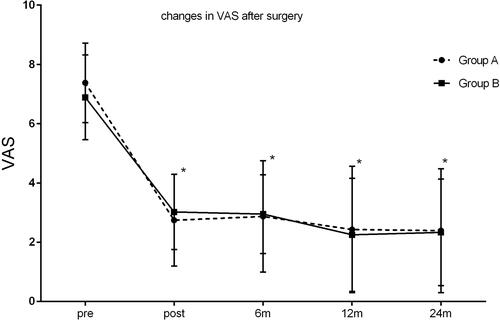
Figure 5 Changes in von Frey.
Notes: Tactile detection: There was no difference in von Frey of group A and group B before the treatment (P > 0.05). After the ozone therapy, there was a significant decrease in von Frey (*P < 0.05) of group A and group B. Meanwhile, the von Frey of group A and group B have a significant difference after the ozone therapy (#P<0.05).
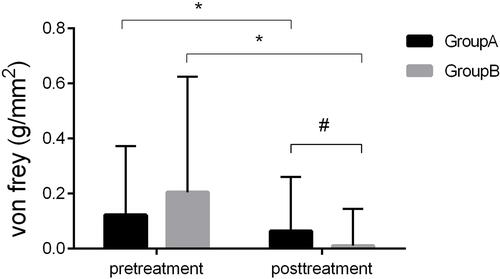
Table 3 Univariate Analysis of Possible Outcome Predictors for Injection Effectiveness After 6 Months
Table 4 Multiple Logistic Regression Analysis of Possible Outcome Predictors for Injection Effectiveness After 6 Months
Table 5 Patient Characteristics at 2 Years Follow-Up
Table 6 Multiple Logistic Regression Analysis of Possible Outcome Predictors for Injection Effectiveness After 2 Years