Figures & data
Table 1 Primer Sequence for Gene Expression Analysis
Figure 1 Key proteins and mRNA expression related to mitochondrial biogenesis and function as well as ultrastructural pattern of muscle fibers. Level of (A) PGC-1α mRNA, (E) PGC-1α protein, (B) SIRT3 mRNA, (F) SIRT3 protein, (C) NRF-1 mRNA, (G) NRF-1 protein, (D) TFAM mRNA and (H) TFAM protein were determined in GM muscle from control group and modelled rat. (I) indicates the result for Western blotting. In control group (J), visualized with TEM, large numbers of mitochondria with oval shape (white arrows) accompanying with ridge-like structures inside and intact myofilaments in well-arranged and clean-cut sarcomeres were observed in longitudinal section (J-a, J-b, J-c). At the 15W groups (K), the arrangement of sarcomeres was significantly abnormal, and the myofilaments showed more electron-dense bands with staggered and disarranged characteristic in longitudinal section (K-a, K-b); in addition, vacuoles of the mitochondrial structure, distorted distribution, break and disappearance of the mitochondrial cristae could be seen (white arrows) in longitudinal-section (K-c). The Z-line became thinner than that in control group, which seems like a drifting wave-like line (arrowhead); moreover, the gap between the two Z-lines is enlarged (arrowhead) with irregular space distance. *Indicates there is significantly different from C (3w-PT.vs Control); **Indicates there is significantly different from C (15w-PT.vs Control); P<0.01, n=8 rats for each group. Data are presented as means ± SD. Magnification times of J-a and K-a, ×3400; Magnification times of J-b and K-b, ×13,500; Magnification times of J-c and K-c, ×33,000.
Abbreviations: C, control; PT, post-treatment; w, week.
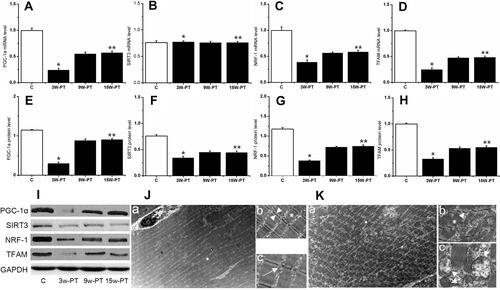
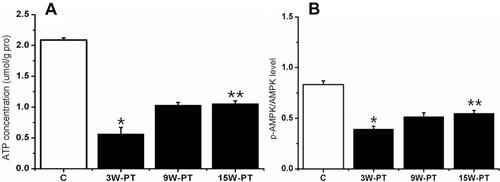
Figure 2 Alternations on level of ATP-generating energy and on ratio of p-AMPK/AMPK activity. Quantification of ATP level (A) and AMP kinase activity (B) by Western blot measuring the ratio between the phosphorylated (p) and total forms (p-AMPK/AMPK) in rats GM in control and model groups at different time points. *Indicates there is significantly different from C (3w-PT. vs Control); **indicates there is significantly different from C (15w-PT. vs Control); P<0.01, n=8 rats for each group. Data are presented as means ± SD. Abbreviations: C, control; PT, post-treatment; w, week.