Figures & data
Table 1 The 15 Countries Producing the Highest Number of Original and Review Articles Investigating Acupuncture for Pain Control
Figure 1 Number of publications investigating acupuncture and pain by year, over the past 20 years.
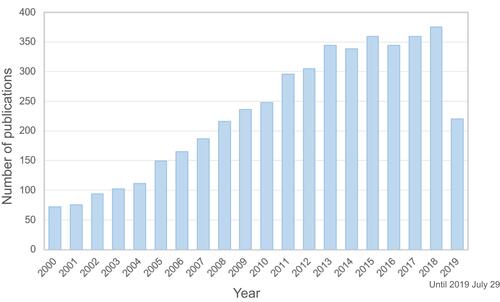
Table 2 The 15 Journals Publishing the Highest Number of Original and Review Articles Investigating Acupuncture for Pain Control
Table 3 The 15 Most Well-Represented Research Areas in Terms of the Number of Original and Review Articles Investigating Acupuncture for Pain Control
Figure 2 Analysis of keywords. (A) Mapping of keywords of studies pertaining to acupuncture and pain (categorized into three groups). (B) Distribution of keywords according to average publication year (blue: earlier, red: later).
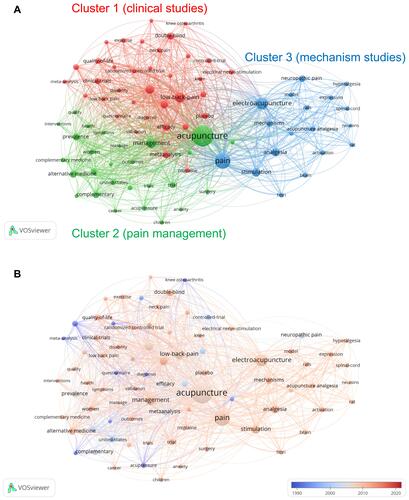
Table 4 Top 15 Authors with Respect to the Number of Original and Review Articles Investigating Acupuncture for Pain Control
Figure 3 Network map of study authors. (A) Of the 16,577 authors (classified into seven clusters), 46 had at least 15 publications. (B) Distribution of authors according to citations.
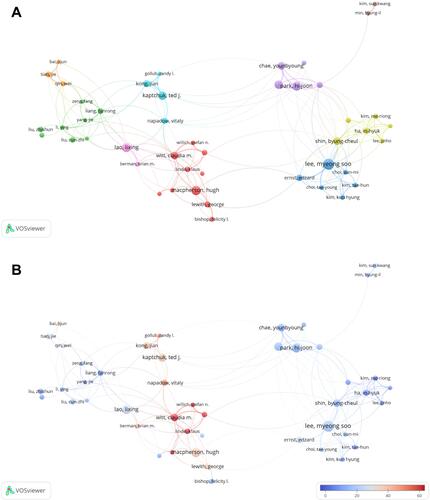
Table 5 Top 15 Organizations with Respect to the Number of Original and Review Articles Investigating Acupuncture for Pain Control
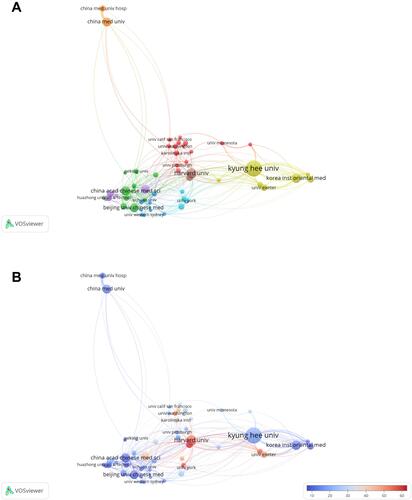
Figure 4 Network map of organizational affiliations. (A) Of the 3899 organizations (classified into seven clusters), 53 were affiliated with at least 30 publications. (B) Distribution of organizations according to citations.