Figures & data
Figure 1 Behavioral effects of neuropathic pain. (A) The dynamics of hot allodynia: the moment of hind paw lifting above the hot plate (+48°C) for the 1-min observation, mean±SEM, n=20 (number of animals), ***p<0.001. (B) The dynamics of cold allodynia: the moment of hind paw lifting above the cold plate (+4°C) for the 1-min observation, mean±SEM, n=20 (number of animals), ***p<0.001. (C) The dynamics of mechanical hyperalgesia: the moment of flexor response of the toes after paw compression, mean±SEM, n=20 (number of animals), ***p<0.001. (D) Spontaneous locomotor activity in “open field”, mean±SEM, n=20 (number of animals), *p=0.045, ***p=0.0004. (E) The step-through latency for animals to enter the dark compartment in passive avoidance test, mean±SEM, n=20 (number of animals), *p=0.0147. (F) Spontaneous alternation rate in Y-maze, mean±SEM, n=20 (number of animals), *p=0.0147.
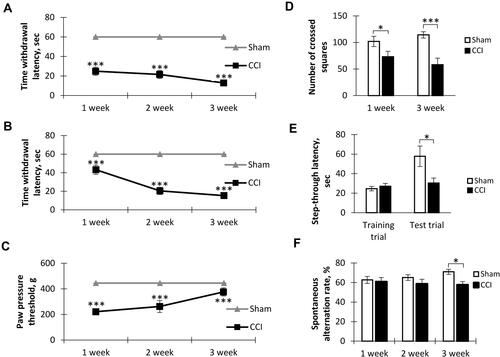
Figure 2 The results of dendrite Sholl analysis and spines density measurement. (A) Number of intersections along the apical dendritic trees at all distances from the soma in CA1 pyramidal neurons, Mean ± SEM, n=5 (number of animals). (B) The total number of branches (left, *p=0.0317) and the total length of apical dendrites (right, *p=0.0317) of CA1 pyramidal neurons, n=5 (number of animals). (C) The number of intersections along the basal dendritic trees at all distances from the soma of CA1 pyramidal neurons, n=5 (number of animals). (D) The total number of branches (left, p=0.22) and the total length of basal dendrites (right, p=0.84) of CA1 pyramidal neurons, n=5 (number of animals). (E) Number of Sholl intersections along the basal dendritic trees at all distances from the soma of DG granule neurons, n=5 (number of animals). (F) The total number of branches (left, *p=0.0159) and the total length of dendrites (right, *p=0.0159) of DG granule neurons, n=5 (number of animals). (G) Density of CA1 pyramidal neurons dendritic spines: total – left (**p=0.0014), mushroom – right (***P<0.0001), n=15 (number of analyzed neurons). (H) Density of DG granule neurons dendritic spines: total – left (*p=0.0283), mushroom – right (**p=0.006), n=15 (number of analyzed neurons). (I) The images of CA1 pyramidal neurons stained by the Golgi-Cox method from the Sham (upper) and CCI (lower) groups. (J) The images of DG granule neurons stained by the Golgi-Cox method from Sham (upper) and CCI (lower) groups. (K) The images of dendritic spines in the CA1-region and DG in Sham (left) and CCI (right) groups.
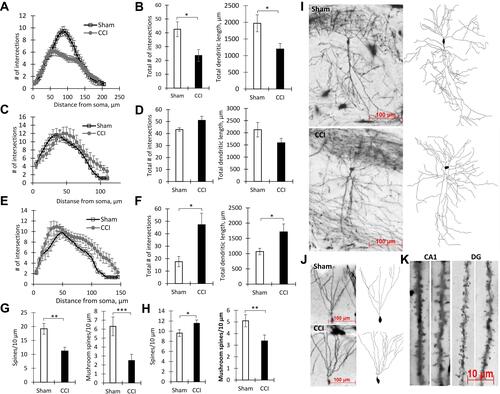
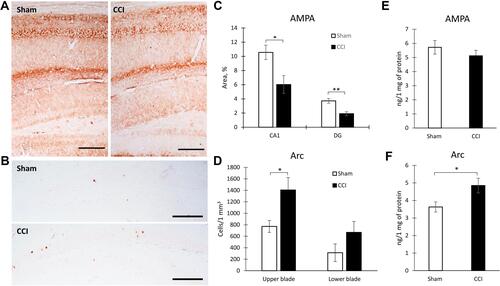
Figure 3 Hippocampal protein expression in Sham and CCI mice. Representative images of AMPARs (A) and Arc protein (B) immunohistochemical staining, Scale bar: 250 microns. (C) The percentage of area covered by AMPARs-positive staining within the hippocampal CA1 (*p=0.0185) and DG areas (**p=0.0006) of Sham-operated and CCI mice, %, n=10 (number of animals). (D) The percentage of area covered by Arc-positive staining within the hippocampal DG (*p=0.0316) of Sham-operated and CCI mice, %, n=10 (number of animals). (E) The hippocampal AMPARs expression, n=15 (number of analyzed samples), p=0.067. (F) The hippocampal Arc expression, n=15 (number of analyzed samples), *p=0.04.