
Figures & data
Table 1 Age, Gender, Height, Weight, and Body Mass Index Between the Two Groups at Baseline
Figure 1 The enrollment and outcomes of patients.
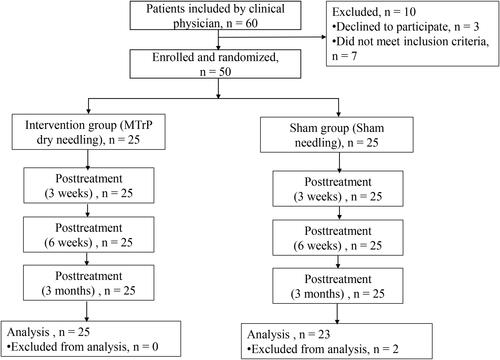
Figure 2 The VAS scores in the TrP-DN group and the Sham group.
Notes: *Compared with the same group at pre-treatment p<0.05, #Compared with the same group at 3 weeks after treatment p<0.05, ▲Compared with the control group p<0.05. n=25 in the TrP-DN Group; n=23 in the Sham group. Abbreviations: TrP-DN, trigger point dry needling; Pre, Pre-treatment; 3w, 3 weeks after treatment; 6w, 6 weeks after treatment; 3m, 3 months after treatment.
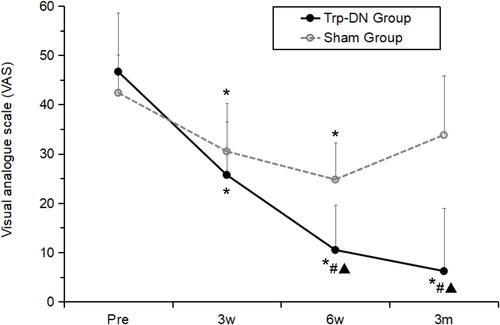
Figure 3 The Kujala scores in the TrP-DN group and the Sham group.
Notes: *Compared with the same group at pre-treatment p<0.05, #Compared with the same group at 3 weeks after treatment p<0.05, ▲Compared with the control group p<0.05. n=25 in the TrP-DN Group; n=23 in the Sham group.
Abbreviations: TrP-DN, trigger point dry needling; Pre, Pre-treatment; 3w, 3 weeks after treatment; 6w, 6 weeks after treatment; 3m, 3 months after treatment.
