Figures & data
Table 1 Characteristics of Study Subjects According to Categories of Self-Reported Headache Recurrence
Table 2 The Mean Number of Absenteeism Days during Years 2014–2015, and the Mean Level of Presenteeism (VAS 0–100) According to the Self-Reported Headache Recurrence Categories
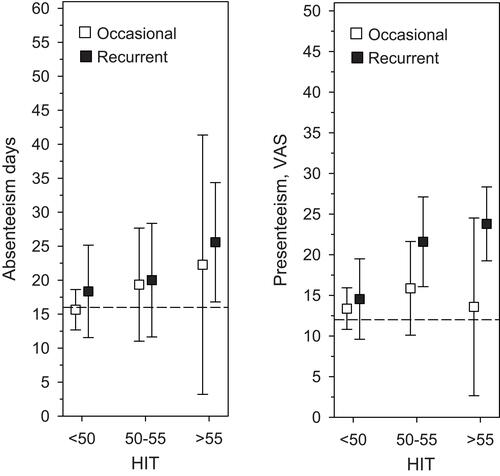
Figure 1 The mean number of absenteeism days during years 2014–2015 and the level of presenteeism (VAS 0–100) by HIT-6 categories in the self-reported occasional and recurrent headache groups. Error bars are for 95% confidence intervals. Dashed lines indicate mean values of absenteeism days and presenteeism in the whole study population. Data was adjusted using model IV (adjusted for age, BMI, education years, smoking, AUDIT-C score, LTPA, MDI score, BBI score, daytime work, and number of chronic illnesses).