Figures & data
Figure 1 Flowchart of the multi-objective optimization framework used for the present paper.
Abbreviations: AUC, area under the curve; KNN, k-nearest neighbors; MSE, mean squared error; NSAID, nonsteroidal anti-inflammatory drug; OPERA, Optimizing Patient Experience and Response to Topical Analgesics; PCA, principal component analysis; ROC, receiver operating characteristic; SVR, Support Vector Regression.
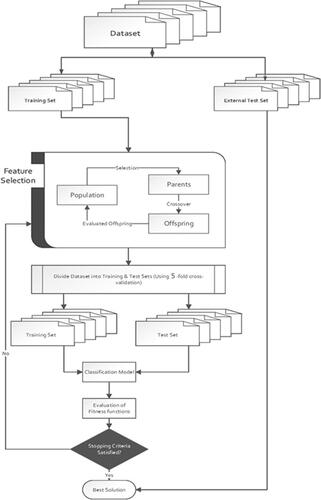
Figure 2 PCA representation and clustering analysis. Circles and Rectangles denote the improvement or deterioration in the following study’s outcomes, respectively: (A) total drugs change after minus before suggested pain therapy, (B) total interference change after minus before suggested pain therapy, (C) total severity change after minus before suggested pain therapy, (D) total complaints change after minus before suggested pain therapy.
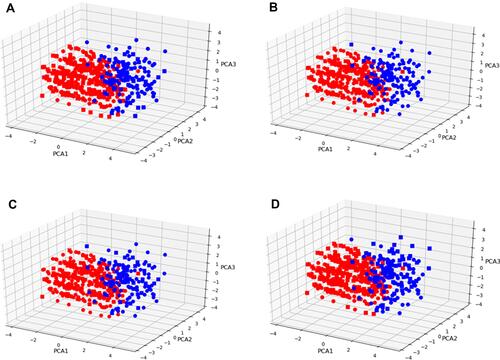
Figure 3 Spearman correlations of all features against the OPERA study’s outcomes. Correlations are depicting in red-blue color scale with the biggest the circle corresponding to a stronger correlation. Insignificant correlations with p-value less than 0.05 were not depicted.
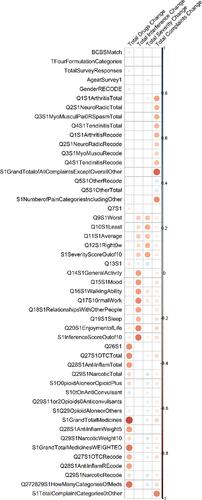
Figure 4 Predictive analytics results for the four outcomes (A–D) using proposed machine learning algorithm and comparing it with other contemporary machine learning algorithm implementations.
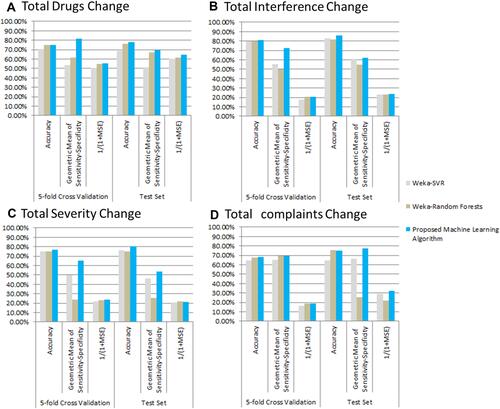
Figure 5 ROC analysis on the test set for the prediction of the four different outcomes of the OPERA study.
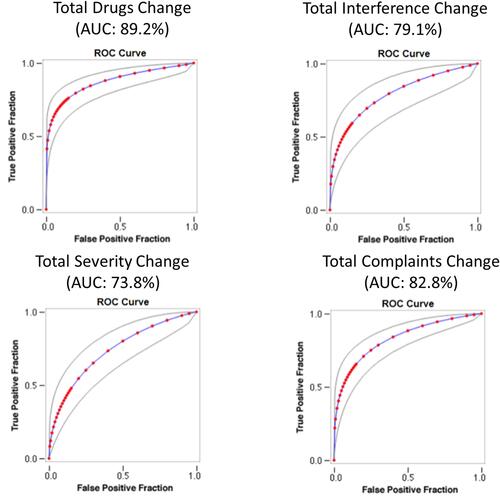
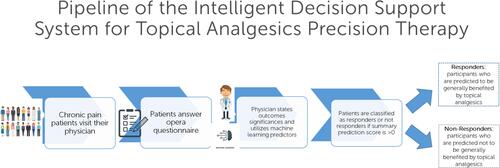
Figure 6 Application of intelligent decision support system for the individualized medicine pipeline of topical analgesics therapy.