Figures & data
Table 1 Characteristics of Participants
Figure 1 Experimental design. Each run lasted 3 minutes and was comprised of four 45 second blocks (2 experimental conditions and 2 rest periods). There was a 10-minute interval between each run to insure that no pain sensitization occurred. The order of the administration of each stimulus in each run was counterbalanced between each participant in a pseudo-randomized manner.
Abbreviation: fMRI, functional magnetic resonance imagining.
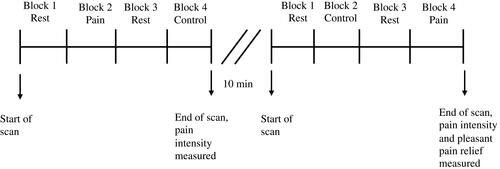
Table 2 Brain Regions (De-)activated During the Modified Cold Pressor Test
Figure 2 Brain regions (de-)activated during the modified cold pressor test. Two contrasts were analysed: [Pain >Control] and [Control>Pain]. (A) Activations; [Pain>Control] contrast. (B) De-activations; [Control>Pain] contrast.
Abbreviations: a, L-caudate nucleus; b, L/R-thalamus; c, L-paracentral lobule; d, L/R-insula; e, L-precuneus; f, L-putamen; g, L-middle frontal gyrus; h, R-medial orbital.
![Figure 2 Brain regions (de-)activated during the modified cold pressor test. Two contrasts were analysed: [Pain >Control] and [Control>Pain]. (A) Activations; [Pain>Control] contrast. (B) De-activations; [Control>Pain] contrast.Abbreviations: a, L-caudate nucleus; b, L/R-thalamus; c, L-paracentral lobule; d, L/R-insula; e, L-precuneus; f, L-putamen; g, L-middle frontal gyrus; h, R-medial orbital.](/cms/asset/d3c37fa9-5564-40ff-9143-5fea88af8296/djpr_a_12170419_f0002_c.jpg)
Figure 3 Mean beta. Three mean beta values were extracted for the right medial orbital frontal gyrus in the control>pain contrast. The average beta value for the contrast control>pain was 0.35 ± 0.09, the average beta value for this contrast during painful stimulation was −0.41 ± 0.11 and during the administration of the control stimulus was −0.16 ± 0.09. These negative values show de-activation in the right medial orbital during both the pain and the control stimuli. However, the de-activation was greater during painful stimulation.
Abbreviations: L, left; ctl, control.
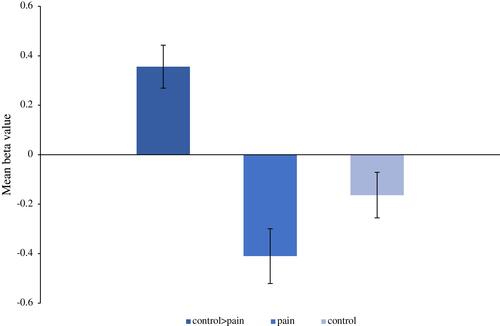
Figure 4 (A) Correlation between the mean beta values of the insula and the mean pain intensity ratings taken during the administration of the modified CPT. This figure illustrates a significative positive correlation between the mean beta values of the insula and the mean pain intensity rating during the administration of both CPT. (B) Correlation between the mean beta values of the precuneus and the mean pain intensity ratings taken during the administration of the modified CPT. This figure illustrates a significative positive correlation between the mean beta values of the precuneus and the mean pain intensity rating during the administration of both CPT.
Abbreviation: CPT, cold pressor test.
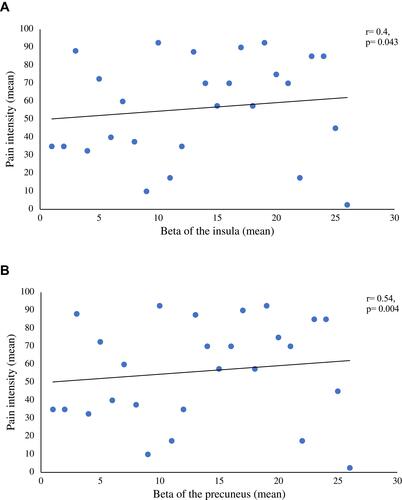
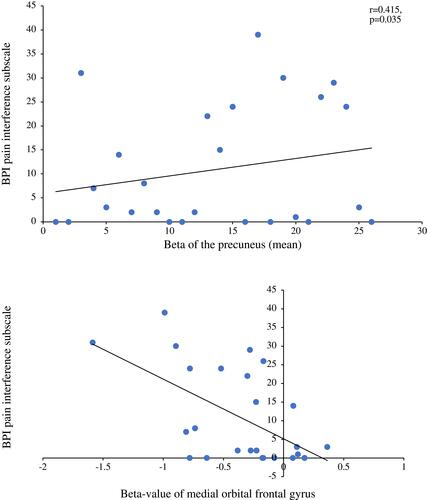
Figure 5 (A) Correlation between the beta values of the precuneus with the BPI questionnaire (pain interference subscale). This figure illustrates a positive significant correlation between the precuneus during a painful stimulation and the pain interference subscale of the BPI questionnaire. (B) Correlation between the beta values of the medial orbital frontal gyrus with the BPI questionnaire (pain interference subscale). This figure illustrates a negative significant correlation between the medial orbital frontal gyrus during painful stimulation and the pain interference subscale of the BPI questionnaire.
Abbreviation: BPI, Brief Pain Inventory.