Figures & data
Figure 1 Interview: The personnel interviewed the participants and recorded their gender, their age, and the intensity with which they perceived a standard pressure stimulus on their middle fingers and on their ear lobes. “0” was no sensation at all; “10” was the strongest imaginable pain.
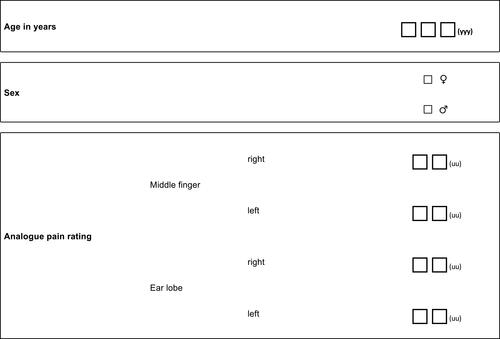
Figure 2 Participant flow: All participants provided full data.
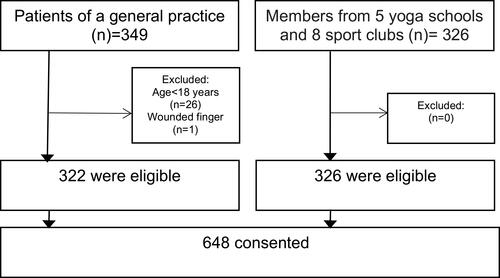
Table 1 Number of Participants by Age Category and Gender
Table 2 Percentages by Level of Pressure Sensitivity, Measurement Site, and Gender
Figure 3 Pressure sensitivity on the middle finger in 648 healthy individuals. Provided that our sample is representative, 25% of the pain-free individuals are below the lower quartile, 25% are between the median and the adjacent quartile, and 10% are beyond the 90th centile. The middle lines are our estimates, and the 95% confidence bands indicate their statistical precision. Given that they are narrower than one measurement unit, the statistical uncertitude is smaller than the measurement uncertitude. Thus, the statistical power is sufficient. The median increase in pressure sensitivity starts with the age of 40 years and reaches its top difference of one measurement unit at the age of 75 years. The absolute minimal clinically important difference for 0 to 10 numeric rating scales is at least two units, and the relative minimal clinically important difference is 30%. In other words, the increase from 40 to 75 years is relatively relevant to its onset but absolutely, one point is too little to be meaningful for patients.
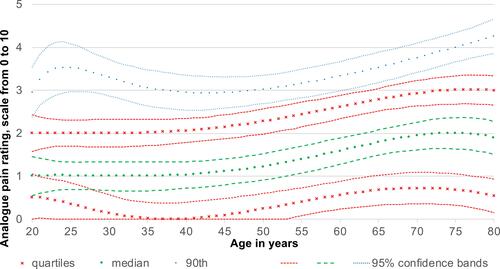
Figure 4 Pressure sensitivity on the ear lobe in 648 healthy individuals. Provided that our sample is representative, 25% of the pain-free individual are below the lower quartile, 25% are between the median and the median and the adjacent quartile, and 10% are beyond the 10th and 90th centile. The middle lines are our estimates, and the 95% confidence bands indicate their statistical precision. Given that they are narrower than one measurement unit, the statistical uncertitude is smaller than the measurement uncertitude. Thus, the statistical power is sufficient. The median of pressure sensitivity decreases from the age of 20 years to a minimum at 30 years and increases to its top difference of 1.2 measurement units at the age of 76 years. The absolute minimal clinically important difference for a zero to ten numeric rating scales is at least two measurement units, and the relative minimal clinically important difference is 30%. In other words, the increase from 30 to 76 years is neither relatively nor absolutely meaningful for the perception of patients.
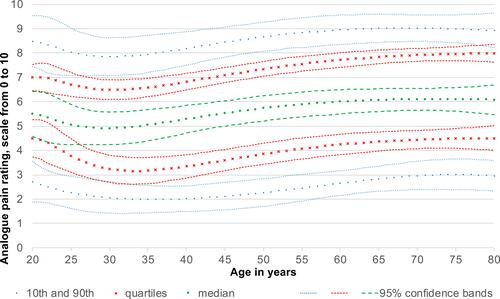
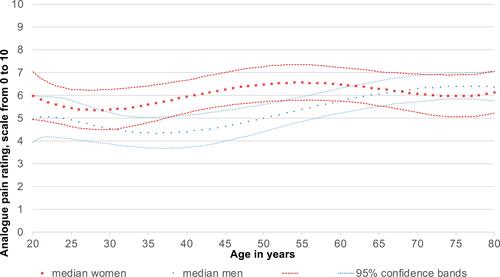
Figure 5 Pressure sensitivity on the finger in 347 women compared to 301 men. Provided that our sample is representative, the medians split the individuals of the respective gender in two equally large groups. The middle lines are our estimates, and the 95% confidence bands indicate their statistical precision. Due to the smaller number of individuals, the gender-specific confidence bands are wider than the overall confidence bands. However, they remain narrower than one unit. Thus, the gender-specific statistical power is sufficient, too. The difference between men and women fluctuates between zero and 0.6 units. This difference is below the individual perception of one unit and clearly below the minimal clinically important difference of two units. It is below statistical significance, too, as the 95% confidence bands overlap. The median increase in pressure sensitivity in men starts to increase with the age of 40 years and reaches its maximum difference of half a measurement unit at the age of 70 years. In women pressure sensitivity increases from 20 years to 32 years reaching a first peak followed by a slight dip and a second peek with 76 years with a maximum difference of 1.2 measurement units.
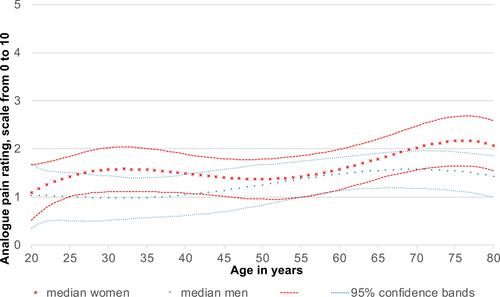
Figure 6 Pressure sensitivity on the ear lobe in 347 women compared to 301 men. Provided that our sample is representative, the medians split the individuals of the respective gender in two equally large groups. The middle lines are our estimates, and the 95% confidence bands indicate their statistical precision. Due to the smaller number of individuals, the gender-specific confidence bands are wider than the overall confidence bands. They are wider than one unit. The difference between men and women ranged between zero and 1.6 measurement units. The largest difference in pressure sensitivity between men and women is between 40 and 50 years. During this period, the sensitivity of both sexes increases. The absolute minimal clinically important difference for zero to ten numeric rating scales is at least two measurement units, and the relative minimal clinically important difference is 30%. In other words, the difference between women and men is not meaningful.