Figures & data
Table 1 Demographic and Clinical Characteristics of Variables
Table 2 Results of ACTH Stimulation Test, LNSC, Symptoms of AI, Cushing’s Syndrome, Total Duration of ESIs in Months, and Total Number of ESIs
Figure 1 Flow diagram of the study.
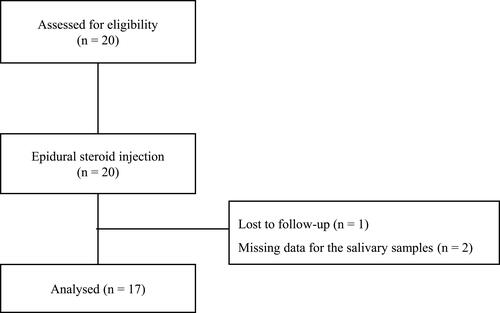
Table 3 Results of Univariate Binary Logistic Regression Analysis Using Incidence of AI as Response
Table 4 Fixed Effect of Time and Covariates
Table 5 Comparison of the Slope of SC Concentration Between AI and Non-AI Groups
Table 6 Comparison of the Mean SC at Each Time Between the AI and Non-AI Groups
Figure 2 Comparison of the increment rate of SC concentration according to time between the AI group and non-AI groups. (A) Comparison of the mean difference of the slope of the mixed effect model between the AI and non-AI groups expressed as 1/4Q, median, and 3/4Q. (B) Comparison of the mean difference of the slope of linear regression between the AI group and non-AI groups expressed as 1/4Q, median, and 3/4Q. *p value < 0.05.
Abbreviations: SC, salivary cortisol; AI, adrenal insufficiency; Q, quartile.
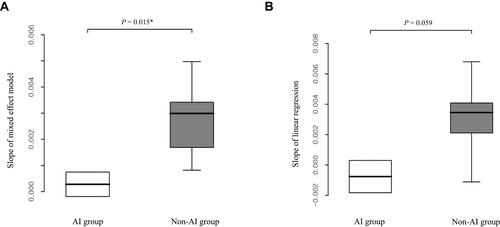
Figure 3 Comparison of the trend of SC for each patient. Black dotted line is linear regression line estimated using population. Red dashed line is the fitted line estimated using a mixed effect model. Blue solid line is linear regression line estimated using subject-specific data. Blue point circle is SC level measured at the corresponding time. X axis shows the time represented as day. Cases 03 and 17 were AI subjects.
Abbreviations: SC, salivary cortisol; AI, adrenal insufficiency.
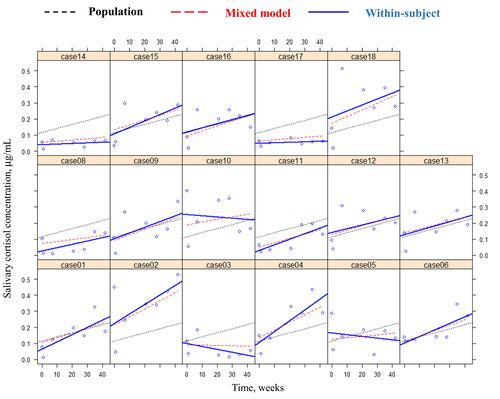
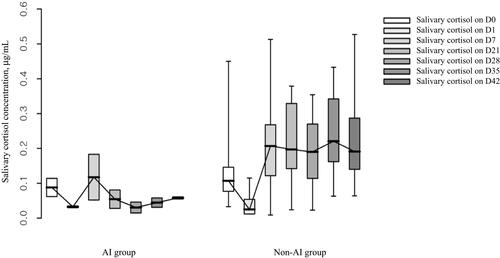
Figure 4 Time trend of mean SC according to complication. The time course and response pattern (mean ± SD) in SC. After the experimental ESI, SC concentrations of all subjects were initially suppressed (D1). In most of the subjects in the non-AI group, SC concentration returned to the normal range of values. However, in the AI group, the SC concentration did not return to the normal range.
Abbreviations: ESI, epidural steroid injection; SC, salivary cortisol; AI, adrenal insufficiency; SD, standard deviation.