
Figures & data
Figure 1 Consolidated Standards of Reporting Trials (CONSORT) flow chart of the three consecutive randomized controlled trials.
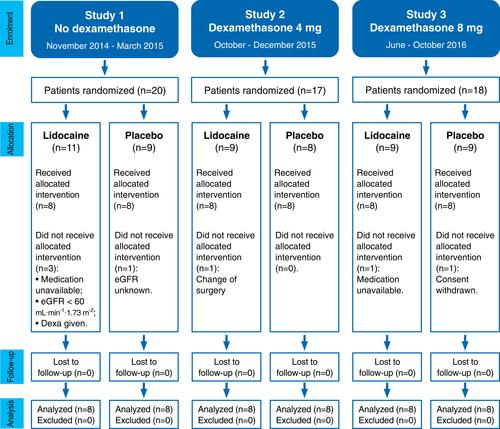
Table 1 Patients’ Perioperative Characteristics in the Three Consecutive Randomized Controlled Trials
Figure 2 Difference (Δ) between interleukin (IL)-6, IL-10 plasma levels and ratio IL-6/IL-10 at baseline (t0) and those 4 hours after surgery (t2) in six groups (n=8 per group). Each symbol represents one patient. A symbol above or below the zero line represents an increase or decrease, respectively, from t0 to t2. Error bars are the 25th–75th percentiles around the medians. (A) Observations for ΔIL-6 and (B) for ΔIL-10 per group. (C) Observations for the ratio ΔIL-6/IL-10 per group and linear regression of the pooled observations on the duration of surgery. The full regression line is accompanied with dotted lines showing its 95% confidence limits. There is one missing value in the group dexamethasone 8 mg with placebo for ΔIL-10 and ΔIL-6/IL-10. Plac, placebo; Dexa, dexamethasone; Lido, lidocaine.
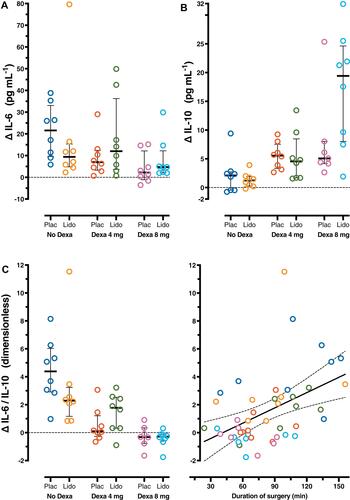
Figure 3 Difference (Δ) between interleukin (IL)-1β, IL-1Ra plasma levels and ratio IL-1β/IL-1Ra at baseline (t0) and those 4 hours after surgery (t2) in six groups (n=8 per group). Each symbol represents one patient. A symbol above or below the zero line represents an increase or decrease, respectively, from t0 to t2. Error bars are the 25th–75th percentiles around the medians. (A) Observations for ΔIL-1β and (B) for ΔIL-1Ra per group. (C) Observations for the ratio ΔIL-1β/IL-1Ra per group and linear regression of the pooled observations on the duration of surgery. The full regression line is accompanied with dotted lines showing its 95% confidence limits. Plac, placebo; Dexa, dexamethasone; Lido, lidocaine.
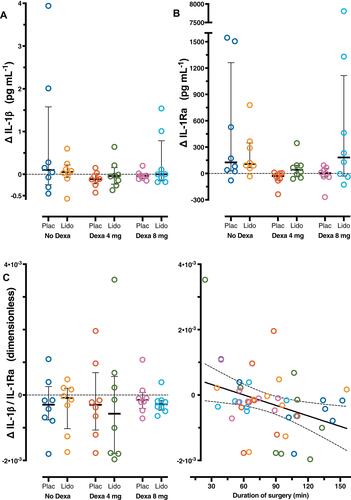
Table 2 The Effects (Column “b”) of Lidocaine, Dexamethasone 4 mg, Dexamethasone 8 mg and Surgery Duration on the Levels of Interleukins and Their Ratios After Surgery
Table 3 Relationships Between Cytokine Levels, Pain Scores and Postoperative Complications