Figures & data
Figure 1 (A) Diagram of endogenous pain-modulation pathways that regulate nociceptive transmission at the spinal trigeminal nucleus. Orange, nociceptor afferent projection; blue, efferent projection from the periaqueductal gray matter; green, efferent projection from the rostral ventromedial medulla (RVM). (B) A single-subject, single-voxel representation of a block analysis used to assess brainstem connectivity during fluctuations in spontaneous pain. In this analysis, connectivity between the RVM and every other voxel in the brainstem was determined during two 50-second periods, one during an individual subject’s lowest pain (blue shading) and a second during their highest pain (pink shading). Pain intensity was assessed on a visual analogue scale (VAS) from 0 = no pain to 10 = highest imaginable pain. (C) In addition to the block analysis, a sliding-window analysis was performed in which RVM connectivity was assessed during a 50-second period (window 1 grey box) which was then moved forward by 2 seconds (window 2 black box) and another connectivity strength value calculated. These RVM connectivity values were compared to corresponding sliding-window pain ratings by linear regression.
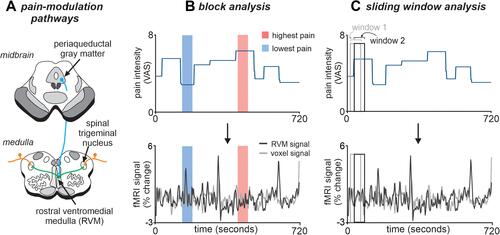
Figure 2 Ongoing pain intensity ratings during the 12-minute functional magnetic resonance imaging scan in 19 subjects with painful trigeminal neuropathy. Pain intensity was assessed on a visual analogue scale (VAS) from 0 = no pain to 10 = highest imaginable pain. The 12 subjects in which pain fluctuated throughout the scan are shown on the left and it is clear that they all display pain intensity changes throughout the entire scanning period. In contrast, plotted on the right are the 7 stable pain subjects. Apart from an initial change in 2 subjects, pain intensity remains relatively stable in all subjects throughout the 12-minute scanning period. The grey shading represents the evenly-spaced periods during which RVM functional connectivity was calculated for the stable pain subjects.
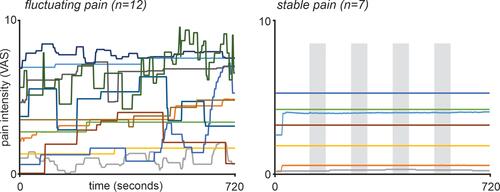
Table 1 Painful Trigeminal Neuropathy Subject Characteristics
Table 2 Montreal Neurological Institute (MNI) Coordinates, Cluster Sizes and t-Values for Regions of Significant Increases in RVM Block Functional Connectivity (FC) During Highest Pain Compared to Lowest Pain in Fluctuating Pain Subjects (n=12)
Figure 3 Significant differences in rostral ventromedial medulla (RVM) functional connectivity (FC) strength between periods of high versus low pain in 12 fluctuating pain subjects. The overlay on the left shows the RVM seed in blue and shows regions in which RVM FC strength was greater during high compared with low pain (hot color scale) overlaid onto axial slices of the SUIT template in the 12 fluctuating pain subjects. The slice locations in Montreal Neurological Institute space are shown at the top left of each slice. Note that RVM FC was greater during high pain in the region of the midbrain periaqueductal gray matter and the spinal trigeminal nucleus. The plots to the left show mean±SEM RVM FC strengths during lowest pain (block 1) and highest pain (block 4). The center plots show the 12 individual subject RVM FC values during lowest and highest pain blocks. Note that as pain increases, 11 of the 12 subjects display an increase in RVM FC strength with the periaqueductal gray and 9 subjects show similar increases in RVM FC strength with the spinal trigeminal nucleus. The dose-response plots to the right show mean±SEM RVM FC strengths during four blocks of increasing pain from lowest pain to highest pain. Note that as pain increases so does RVM FC strength. *Significant difference determined in the voxel-by-voxel analysis.
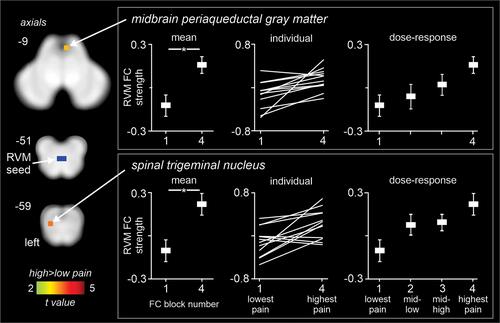
Figure 4 Plots of mean±SEM rostral ventromedial medulla (RVM) functional connectivity (FC) strength during four blocks evenly spaced during the 12-minute scan in the 7 stable pain subjects. The region of the midbrain periaqueductal gray matter and spinal trigeminal nucleus that were examined are indicated by the black shading and arrow on the overlays to the left.
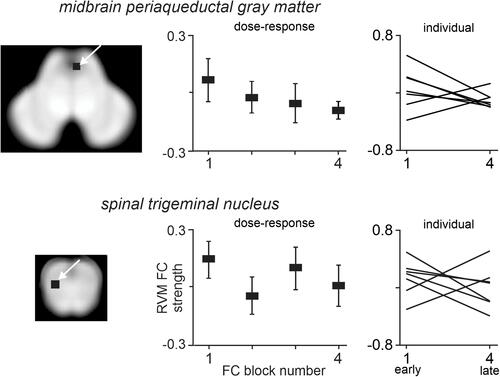
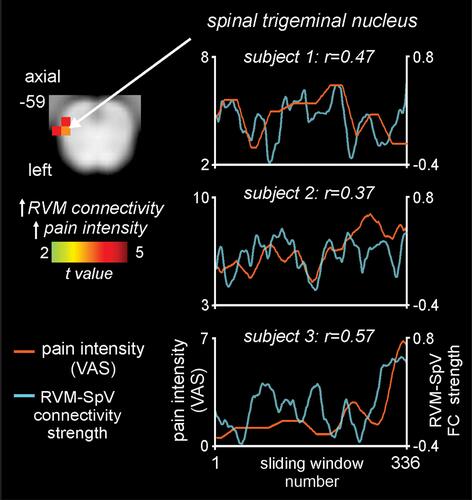
Figure 5 Brainstem region in which rostral ventromedial medulla (RVM) dynamic functional connectivity (FC) strength covaries significantly with ongoing pain in 10 fluctuating pain subjects. The overlay on the left shows the region of the spinal trigeminal nucleus (SpV) where RVM dynamic connectivity covaries positively (hot color scale) with pain measured on a visual analogue scale (VAS) from 0 = no pain to 10 = highest imaginable pain. Slice location in Montreal Neurological Institute space is shown at the top left of the axial slice. To the right are plots of pain intensity (orange line) and RVM-SpV connectivity strength (blue line) in three subjects. Note the ongoing relationship between changes in pain intensity and RVM-SpV connectivity strength.