
Figures & data
Table 1 Demographic and Clinical Characteristics
Figure 1 Patient enrollment flow diagram.
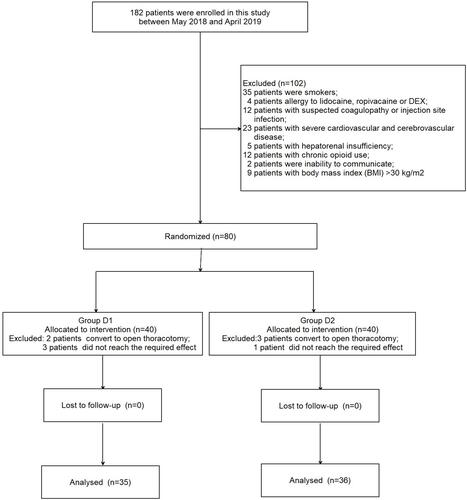
Table 2 Intraoperative Variables Between the Two Groups
Figure 2 Comparison of the intraoperative hemodynamic changes between the two groups. *P<0.05 vs the D1 group.
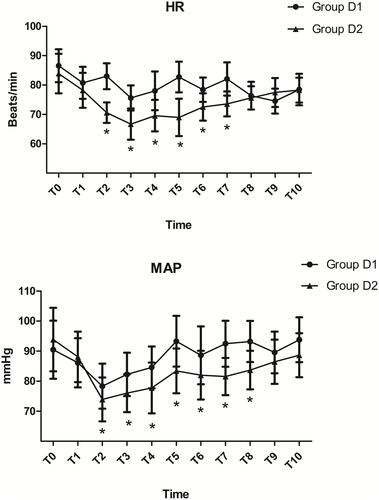
Figure 3 Comparison of postoperative pain intensity (at rest and with coughing) between the two groups. *P<0.05 vs the D1 group.
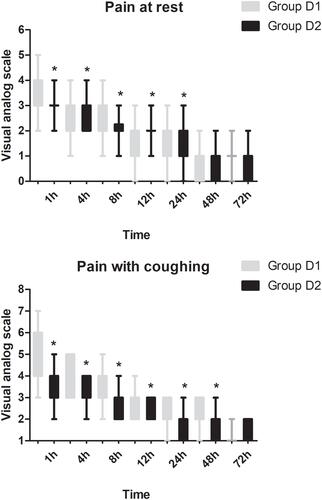
Figure 4 Comparison of postoperative sufentanil consumption between the two groups. *P<0.05 vs the D1 group.
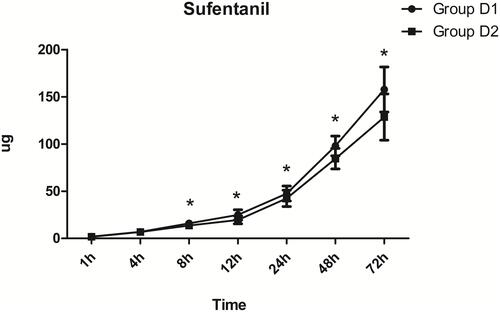
Table 3 Postoperative Variables Between the Two Groups
Table 4 Postoperative Adverse Effects in the Two Groups