Figures & data
Table 1 Baseline Demographic and Clinical Characteristics of the Control, Treatment and Crossover Groups
Table 2 Baseline and Day 14 Brief Pain Inventory Scores for Overall Severity, Severity Questions, Overall Interference, and Interference Questions for the Control, Treatment, and Crossover Groups
Figure 1 Baseline and day 14 overall mean (A) severity and (B) interference scores within the control, treatment, and crossover groups. *95% Confidence Interval of the difference, paired t-test. Each difference is statistically significant.
Abbreviations: CG, control group; TG, treatment group; CROSSG, crossover group.
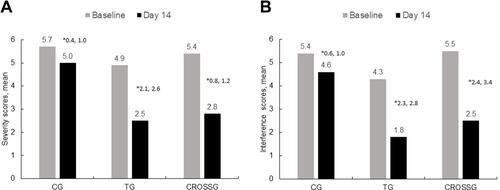
Figure 2 Mean change from baseline to day 14 in overall severity (A) and interference (B) scores within the control, treatment, and crossover groups. *95% Confidence Interval of the difference, unpaired t-test.
Abbreviations: CG, control group; TG, treatment group; CROSSG, crossover group.
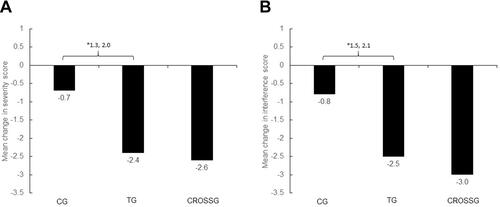
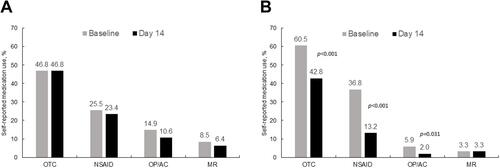
Figure 3 Percent using each type of pain medication at baseline and day 14 within the control (A), and treatment (B) groups.
Abbreviations: OTC, over-the-counter; NSAID, nonsteroidal anti-inflammatory drug; OP, opioid; AC, anticonvulsant; MR, muscle relaxant.