Figures & data
Table 1 Search Strategy for the PubMed Database
Figure 1 Flow Diagram
Abbreviations: SRs, Systematic reviews; RCT, Randomized Controlled Trial.
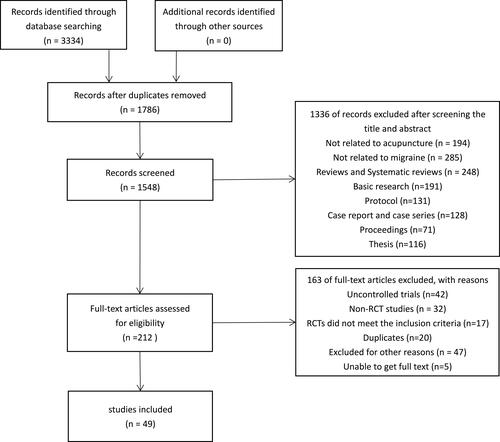
Table 2 Study Characteristics
Figure 2 Annual distribution of the included studies evaluating acupuncture for migraine.
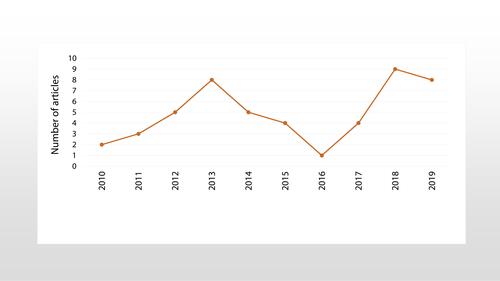
Figure 3 Risk of bias graph: review authors’ judgements about each risk of bias item presented as percentages across all included studies.
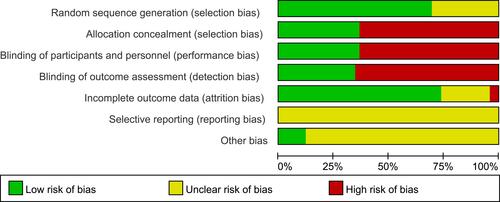
Figure 4 Risk of bias summary: review authors’ judgements about each risk of bias item for each included.
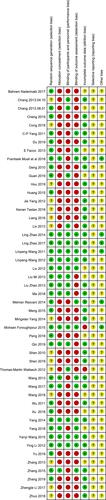
Figure 5 Forest plot of comparison: 1 RA vs. SA, outcome: headache frequency.
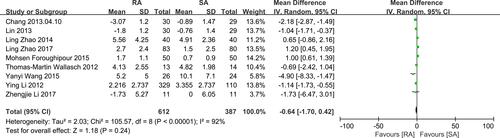
Figure 6 Summary of evidence of comparison: 1 RA vs. SA, outcome: headache frequency.
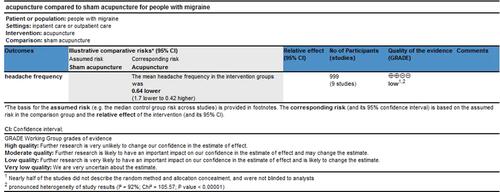
Figure 7 Forest plot of comparison: 2 acupuncture vs. waiting list, outcome: headache frequency.
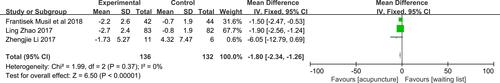
Figure 8 Summary of evidence of comparison: 2 acupuncture vs. waiting list, outcome: headache frequency.
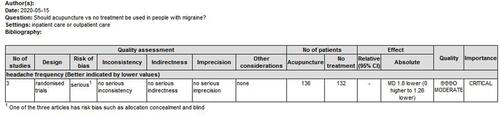
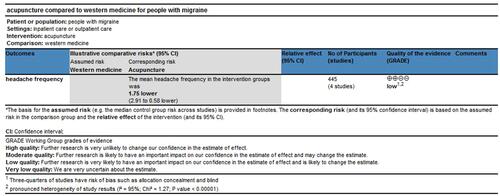
Figure 9 Forest plot of comparison: 3 acupuncture vs. western medicine, outcome: headache frequency.
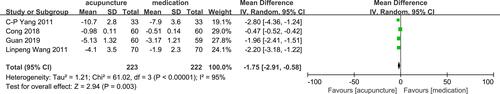
Figure 10 Summary of evidence of comparison: 3 acupuncture vs. western medicine, outcome: headache frequency.