Figures & data
Figure 1 Mechanistic working model.
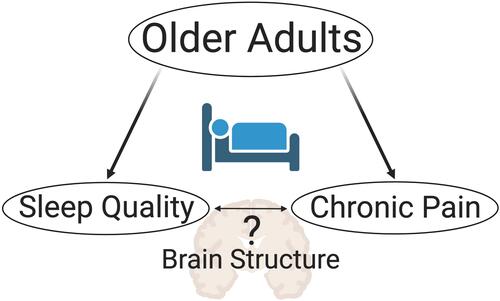
Table 1 Demographic and Clinical Characteristics of the Sample (n=69)
Table 2 Descriptive Statistics of the PSQI and Its Component Scores in Our Study Sample
Table 3 Intercorrelation Matrix Among the PSQI Components (n=69)
Table 4 Associations Between Total PSQI Score and the PSQI Components with Self-Reported Pain and Somatosensory and Pain Threshold Measures (n=69)
Figure 2 Cortical thickness was negatively associated with total PSQI scores (FWE-corrected values after applying threshold-free cluster enhancement (TFCE, p < 0.05)).
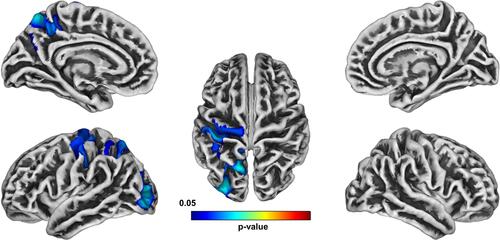
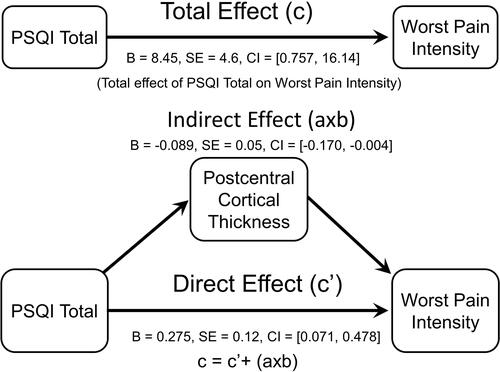
Figure 3 Postcentral cortical thickness mediated the association between PSQI total and worst pain intensity.