80
Views
4
CrossRef citations to date
0
Altmetric
Original Research

The Effects of Body Mass Index on the Use of Patient-Controlled Intravenous Analgesia After Open Gastrointestinal Tumor Surgery: A Retrospective Analysis

, , , , , & ORCID Icon show all
Pages 2673-2684 | Published online: 22 Oct 2020

Figures & data

Table 1 Characteristics of Patients

Figure 1 Characteristics of patients (A) Number of different genders in each subgroup. (B) Percentage of different genders in each subgroup. (C) Age of patients. (D) Number of different age stages in each subgroup. (E) Percentage of different age stages in each subgroup. (F) Height of patients. (G) Weight of patients. (H) Number of different tumor sites in each subgroup. (I) Percentage of different tumor sites in each subgroup. (J) Number of complications in each subgroup. (K) Percentage of complications in each subgroup.

Notes: A: group A (BMI < 18.5kg/m2); B: group B (18.5kg/m2 ≤ BMI < 22kg/m2); C: group C (22kg/m2 ≤ BMI < 24kg/m2); D: group D (24kg/m2 ≤ BMI < 26kg/m2); E: group E (26kg/m2 ≤ BMI < 28kg/m2); F: group F (BMI ≥ 28kg/m2). #The difference of subgroups was statistically significant (p < 0.05).
Figure 1 Characteristics of patients (A) Number of different genders in each subgroup. (B) Percentage of different genders in each subgroup. (C) Age of patients. (D) Number of different age stages in each subgroup. (E) Percentage of different age stages in each subgroup. (F) Height of patients. (G) Weight of patients. (H) Number of different tumor sites in each subgroup. (I) Percentage of different tumor sites in each subgroup. (J) Number of complications in each subgroup. (K) Percentage of complications in each subgroup.

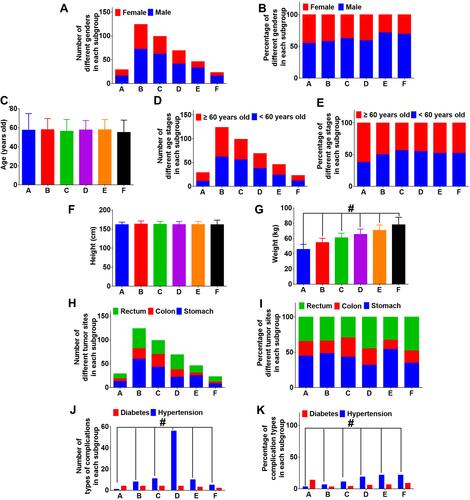
Table 2 Duration of Operation and Use of Analgesics

Figure 2 Duration of operation and use of analgesics. (A) Operation time of the patient (h). (B) Intraoperative use of sufentanil (ug). (C) The number of other analgesics used during the operation. (D) Percentage of other analgesics used during the operation. (E) The number of additional analgesics used after surgery. (F) Percentage of additional analgesics used after surgery.

Notes: A: group A (BMI < 18.5kg/m2); B: group B (18.5kg/m2 ≤ BMI < 22kg/m2); C: group C (22kg/m2 ≤ BMI < 24kg/m2); D: group D (24kg/m2 ≤ BMI < 26kg/m2); E: group E (26kg/m2 ≤ BMI < 28kg/m2); F: group F (BMI ≥ 28kg/m2).
Figure 2 Duration of operation and use of analgesics. (A) Operation time of the patient (h). (B) Intraoperative use of sufentanil (ug). (C) The number of other analgesics used during the operation. (D) Percentage of other analgesics used during the operation. (E) The number of additional analgesics used after surgery. (F) Percentage of additional analgesics used after surgery.

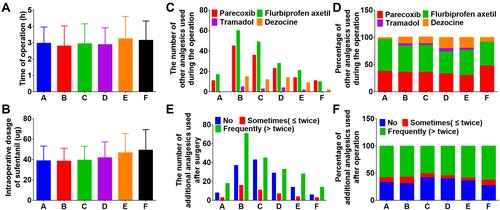
Table 3 VAS Score After Surgery

Figure 3 Postoperative VAS. (A) VAS scores at 24 hours and 48 hours after surgery. (B) The number of moderate to severe postoperative pain. (C) Percentage of moderate to severe postoperative pain.

Notes: A: group A (BMI < 18.5kg/m2); B: group B (18.5kg/m2 ≤ BMI < 22kg/m2); C: group C (22kg/m2 ≤ BMI < 24kg/m2); D: group D (24kg/m2 ≤ BMI < 26kg/m2); E: group E (26kg/m2 ≤ BMI < 28kg/m2); F: group F (BMI ≥ 28kg/m2). #The difference of subgroups was statistically significant (p < 0.05).
Figure 3 Postoperative VAS. (A) VAS scores at 24 hours and 48 hours after surgery. (B) The number of moderate to severe postoperative pain. (C) Percentage of moderate to severe postoperative pain.

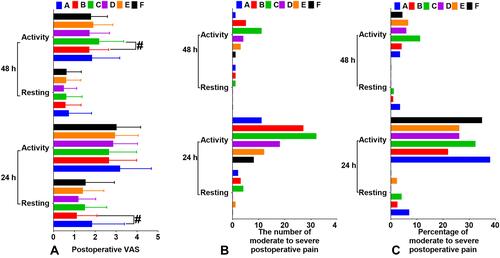
Table 4 Postoperative Adverse Reactions

Table 5 Regression Analysis of Postoperative Vomiting

Figure 4 Postoperative adverse reactions. (A) The number of adverse reaction. (B) The percentage of adverse reaction.

Notes: A: group A (BMI < 18.5kg/m2); B: group B (18.5kg/m2 ≤ BMI < 22kg/m2); C: group C (22kg/m2 ≤ BMI < 24kg/m2); D: group D (24kg/m2 ≤ BMI < 26kg/m2); E: group E (26kg/m2 ≤ BMI < 28kg/m2); F: group F (BMI ≥ 28kg/m2). #The difference of subgroups was statistically significant (p < 0.05).
Figure 4 Postoperative adverse reactions. (A) The number of adverse reaction. (B) The percentage of adverse reaction.

Figure 5 Time from the end of the operation to activities and postoperative quality of life. (A) Time to exhaust to the anus (h). (B) Time to drink water (h). (C) Time to get out of bed (h). (D) Time to pull out the urine tube (h). (E) Time to pull out the abdominal drainage tube (h). (F) Time to pull out the gastric tube (h). (G) Postoperative length of stay (d). (H) Postoperative quality of life.

Notes: A: group A (BMI < 18.5kg/m2); B: group B (18.5kg/m2 ≤ BMI < 22kg/m2); C: group C (22kg/m2 ≤ BMI < 24kg/m2); D: group D (24kg/m2 ≤ BMI < 26kg/m2); E: group E (26kg/m2 ≤ BMI < 28kg/m2); F: group F (BMI ≥ 28kg/m2).
Figure 5 Time from the end of the operation to activities and postoperative quality of life. (A) Time to exhaust to the anus (h). (B) Time to drink water (h). (C) Time to get out of bed (h). (D) Time to pull out the urine tube (h). (E) Time to pull out the abdominal drainage tube (h). (F) Time to pull out the gastric tube (h). (G) Postoperative length of stay (d). (H) Postoperative quality of life.

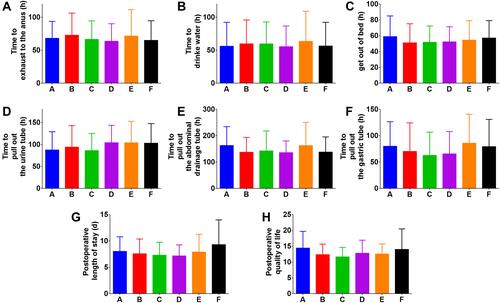
Table 6 Postoperative Activity and Quality of Life Assessments