
Figures & data
Figure 1 Flow diagram of patient selection and study protocol.
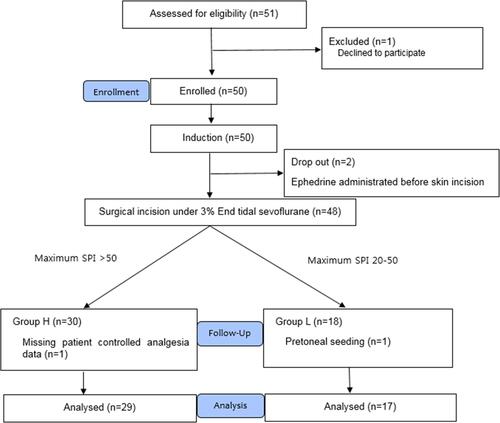
Table 1 Demographic and Surgical Characteristics
Figure 2 The trend for SPI values throughout the perioperative period in both groups. (Time 1: Pre-induction, 2: Pre-incision, 3: Post-incision, 4: 1 h after incision, 5: before arousal, Bispectral index < 60).
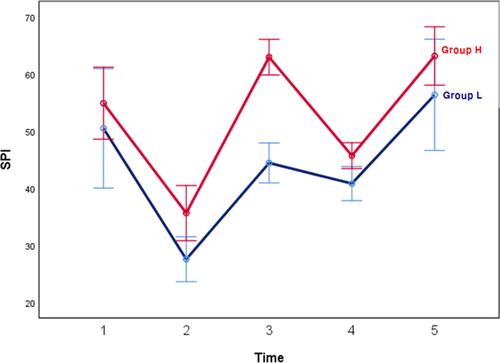
Table 2 Pre-Induction, Pre-Incision and Post-Incisional Surgical Pleth Index, Blood Pressure, Heart Rate, and Bispectral Index
Figure 3 Receiver operating characteristics for SPI during surgery to distinguish different states of postoperative fentanyl consumption (≥1000 μg, 25% quantile of high opioid consumption).
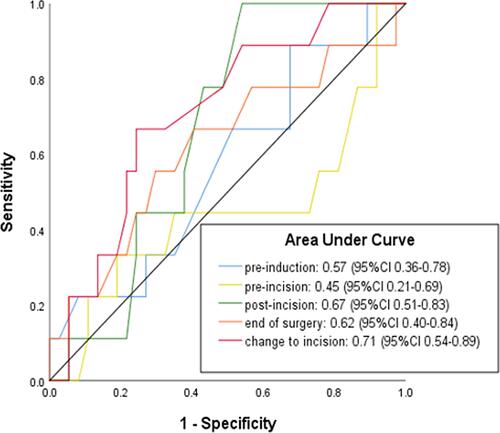
Table 3 The Brief Interview for Assessing Preoperative Anxiety and Psychological Status