Figures & data
Figure 1 Consort diagram of patients.
Abbreviation: IV-PCA, intravenous patient-controlled analgesia.
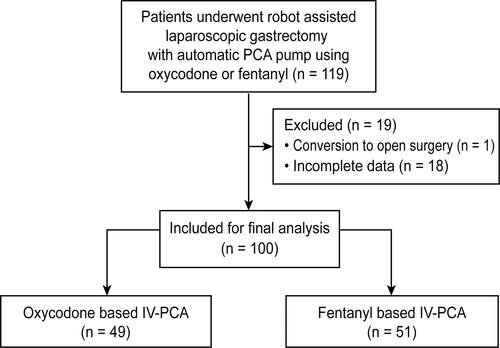
Table 1 Demographics and Intraoperative Parameters
Figure 2 Changes in resting (A) and active (B) pain intensity until 48 hours after surgery.
Abbreviation: NRS, numeric rating score.
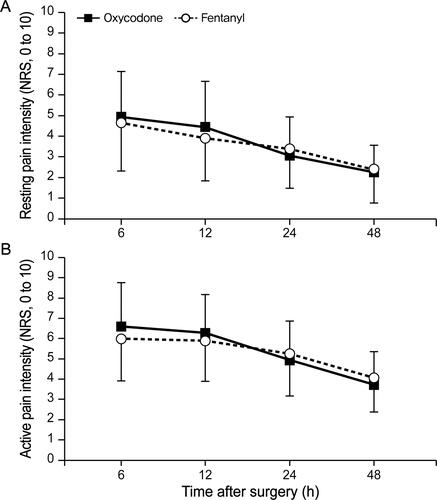
Figure 3 Number of cumulative bolus deliveries (A), cumulative bolus attempts (B), and ratio of deliveries to attempts (C). *Bonferroni-corrected P < 0.05 compared with the fentanyl group.
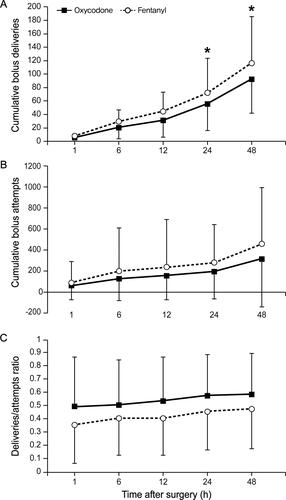
Table 2 Number of Patients Who Required Additional Rescue Analgesics and Expressed PONV During 48 Hours After Surgery
Table 3 Multivariate Regression Analysis of the Number of Patients Requiring Additional Rescue Analgesics and Who Expressed Postoperative Nausea in the PACU
Table 4 Other Adverse Effects During 48 Hours After Surgery
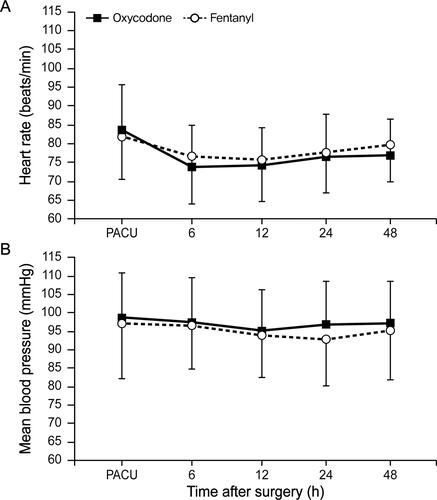
Figure 4 Mean blood pressure (A) and heart rate during 48 h after surgery (B).
Abbreviation: PACU, post-anesthesia care unit.