
Figures & data
Figure 1 Study design and procedure. After completing a battery of questionnaires online, the participants signed in for a laboratory assessment consisting of three parts: (a) baseline (t0); the manipulation of threat expectations was followed by the baseline of pain tolerance, intensity, and unpleasantness; (b) following the presentation of the therapeutic instruction (randomized allocation to either habituation or expectation violation), the participants underwent several exposure trials until a predefined exposure goal was reached. During these exposure trials, the participants were exposed to nociceptive thermal stimuli; (c) a post-test (pain tolerance, intensity, unpleasantness) and a post-assessment of questionnaires was followed by a manipulation check. In a one-week follow-up, pain tolerance, intensity, unpleasantness, and the questionnaires were conducted again before the aims of the study were disclosed to the participants.
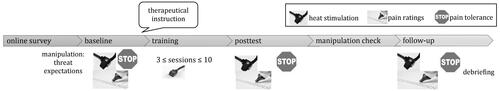
Table 1 Participants’ Demographic Characteristics and Baseline Scores for Both Conditions
Table 2 Baseline Values of Variables of Interest for Both Groups
Figure 2 Number of exposure trials (dose) needed to achieve the predefined exposure goal (responder) by instruction condition.
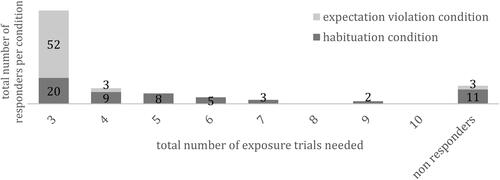
Table 3 Hierarchical Multiple Regression Analysis for Prediction of Number of Exposure Trials Needed