Figures & data
Table 1 Disease Categories and Medical Diagnoses Listed in the CCRS RAI/MDS/FA 2.0
Table 2 Descriptive Characteristics of the Sample, n = 139,573
Table 3 The Five Most Prevalent Combinations of One, Two, Three, Four and Five Disease Categories, Respectively
Table 4 Frequencies of Residents Reporting Various Levels of Pain on the Three Pain Measures Used in the Present Study
Table 5 Examining and Comparing Demographic and Medical Covariates, n = 139,573 (All Residents)
Table 6 Binary Logistic Regression with Pain (Yes/No) Being the Dependent Variable for Individual Disease Categories
Table 7 Binary Logistic Regression with Pain (Yes/No) Being the Dependent Variable for Multimorbid Disease Categories (0–5+)
Table 8 The Top Five Combinations of One, Two, Three, Four and Five Disease Categories with Highest Proportion of Residents Within Each Disease Category or Combination Reporting Pain, Respectively
Table 9 Binary Logistic Regression Using P-Y/N (Pain: Yes/No) as the Dependent Variable for the Number of Disease Categories
Figure 1 PI-4 pain severity ratings by individual single disease category.
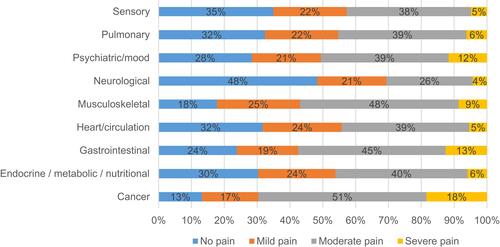
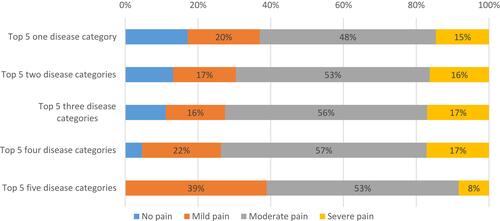
Figure 2 PI-4 pain severity ratings for the top five disease combinations with residents reporting pain.