Figures & data

Figure 1 Photomicrographs showing: (A). Normal liver from a mice in the control group; (B). Liver from a mice with single-cell necrosis of hepatocytes after treatment with PAAC at a dose of 2000 mg/kg bwt; (C). Normal Kidney from a mice in the control group; (D). Kidney from a mice after treatment with PAAC at 2000 mg/kg bwt showing patchy tubular epithelial necrosis.
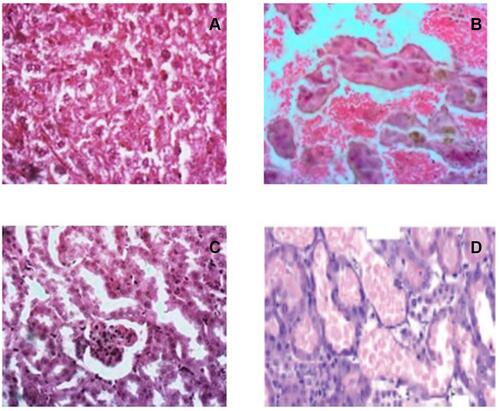
Figure 2 (A). Effect of different doses of the aqueous extract of P. aurita (PAAQ), administered ip, on formalin-induced pain-related behaviour in mice. Data represented as mean ± S.E.M. with each column representing the sum of pain-related behaviour. * indicates p < 0.05 compared to the saline-injected group. (B). Dose-response curve of PAAQ administered ip. The curve was constructed using the total pain-related behaviour of the formalin test against logarithmic transformed PAAQ ip doses of 10,100 1000 and 2000 mg/kg bwt. A sigmoid fit was applied and the equivalent ip dose of extract to the administered doses of ibuprofen was interpolated.
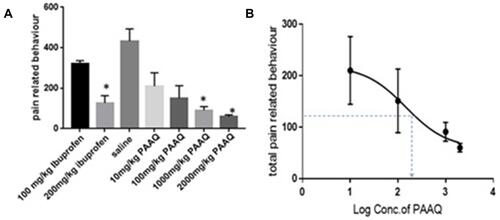
Figure 3 (A). Effect of different doses of the alcohol extract of T. fuscatus (TFAC), administered ip, on formalin-induced pain-related behaviour in mice. Data are presented as mean ± S.E.M. with each column representing the sum of pain-related behaviour. * indicates p < 0.05 compared to the saline-injected group. (B). Dose-response curve of TFAC administered ip. The curve was constructed using the total pain-related behaviour of the formalin test against logarithmic transformed TFAC ip doses of 10,100 1000 and 2000 mg/kg bwt. A sigmoid fit was applied and the equivalent ip dose of extract to the administered doses of ibuprofen was interpolated.
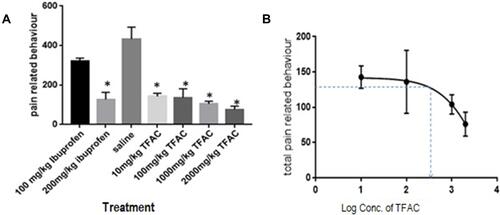
Figure 4 (A). Effect of different doses of the aqueous extract of T. fuscatus (TFAQ), administered ip, on formalin-induced pain-related behaviour in mice. Data are presented as mean ± S.E.M. with each column representing the sum of pain-related behaviour. * indicates p < 0.05 compared to the saline-injected group. (B). Dose-response curve of TFAQ administered ip. The curve was constructed using the total pain-related behaviour of the formalin test against logarithmic transformed TFAQ ip doses of 10,100 1000 and 2000 mg/kg bwt. A sigmoid fit was applied and the equivalent ip dose of extract to the administered doses of ibuprofen was interpolated.
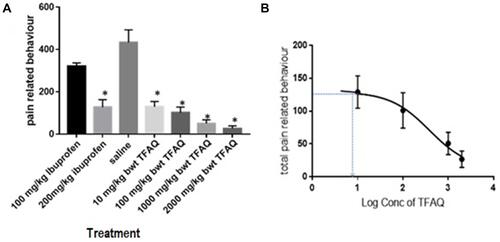
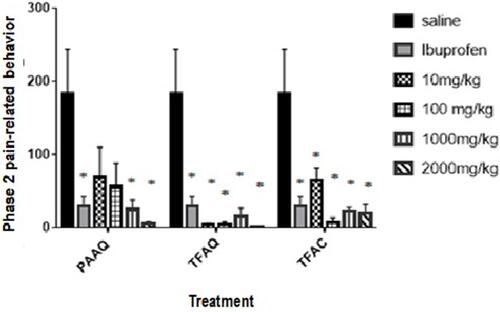
Figure 5 Effect of different doses of PAAQ, TFAC and TFAQ, administered via ip, on the phase 2a formalin-induced pain-related behaviour in mice. Phase 2a represents the time between the 20th and the 40th min of the formalin test. * indicates p < 0.05 when compared to the saline-injected group.