Figures & data
Figure 1 RVM microinjection sites and schematic illustration of the experimental protocol. (A) Carbon black ink indicates the microinjection site in the RVM. Triangles indicate the microinjection sites in the inset figure. (B) Rats received RVM injection of PCPA or saline. (C) Rats received RVM injection of SB203580 or DMSO. (D) Rats received intrathecal injection of ondansetron.
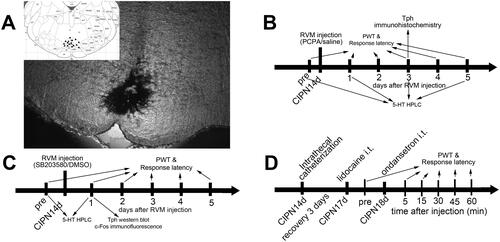
Figure 2 Changes in pain thresholds of paclitaxel-injected rats. (A) Mechanical PWT decreased significantly in the paclitaxel-injected group from day 7 and continued to day 21. (B) The response latencies to thermal stimuli were significantly shortened in paclitaxel-injected rats from day 5 to day 21 after injection. * vs naive group, P < 0.05. # vs sham group, P < 0.05. n=6 per group.
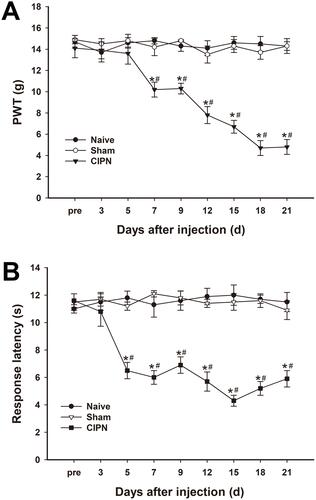
Figure 3 Upregulation of descending serotoninergic projection in CIPN rats. (A) The spinal 5-HT was significantly upregulated on days 7, 14 and 21 after paclitaxel injection compared with the naive and sham group. (B) The expression of Tph was significantly increased in the RVM on days 7, 14, and 21 in CIPN rats compared with the naive and sham group. * vs naive group, P < 0.05. # vs sham group, P < 0.05. n=3 per group.
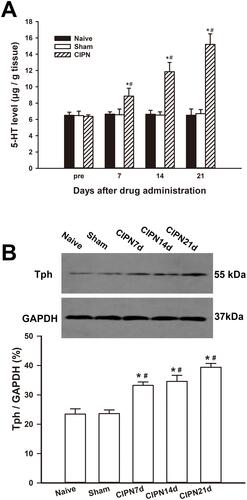
Figure 4 Inhibition of Tph in the RVM attenuates paclitaxel-induced pain. (A) RVM microinjection of PCPA significantly attenuated the chemotherapy-induced mechanical allodynia (* vs CIPN-saline group, P < 0.05). (B) RVM microinjection of PCPA significantly alleviated CIPN-induced heat hyperalgesia (* vs CIPN-saline group, P < 0.05). n=6 per group.
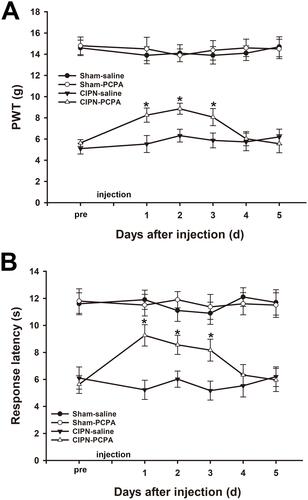
Figure 5 Inhibition of descending serotoninergic projection by RVM microinjection of PCPA. (A–E) Down-regulation of the RVM Tph expression by microinjection of PCPA. (A) Sham-saline group, (B) Sham-PCPA group, (C) CIPN-saline group, (D) CIPN-PCPA group. Bar: 200 μm. (E) Tph neurons count in RVM (n=3 per group, * vs Sham-saline group, P < 0.05, # vs CIPN-saline group, P < 0.05). (F) HPLC showing 5-HT content in the spinal dorsal horn at spinal levels L4–L6 was significantly lower in PCPA-treated rats compared with saline-treated rats in a time-dependent manner (n=3 per group, * vs Sham-saline group, P < 0.05, # vs CIPN-saline group, P < 0.05).
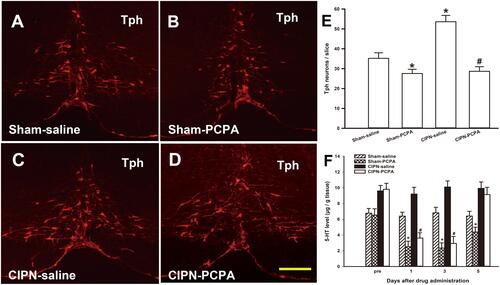
Figure 6 Alleviation of chemotherapy-induced pain through intra-RVM microinjection of SB203580. (A) Mechanical allodynia was significantly attenuated one day after RVM microinjection of SB203580 (* vs CIPN-DMSO, P < 0.05). (B) The thermal pain threshold was significantly reversed at day 1 after RVM microinjection of SB203580 (* vs CIPN-DMSO, P < 0.05). n=6 per group.
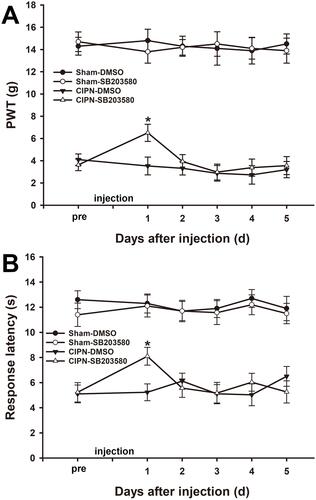
Figure 7 Inhibition of descending serotoninergic projection by intra-RVM microinjection of SB203580. (A) The protein level of Tph in SB203580-treated CIPN rats was significantly lower compared with the vehicle-treated CIPN rats. The expression of Tph was not significantly altered by SB203580 in sham rats (# vs CIPN-DMSO, P < 0.05, * vs Sham-DMSO group, P < 0.05, n=3 per group). (B) HPLC showing that the 5-HT level in the dorsal spinal cord was significantly decreased in SB203580-treated CIPN rats compared with DMSO-treated CIPN rats (P < 0.05). 5-HT content in the dorsal spinal cord was not significantly altered in SB203580-treated sham rats (# vs CIPN-DMSO group, P < 0.05, * vs Sham-DMSO group, P < 0.05, n=3 per group).
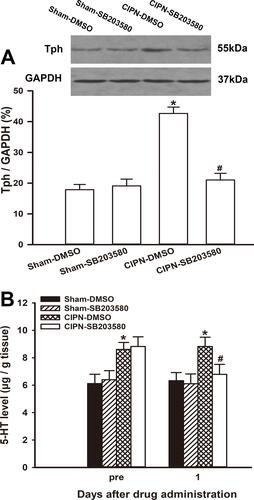
Figure 8 Reduction of c-Fos expression in spinal cord by intra-RVM microinjection of SB203580. The immunofluorescence of c-Fos in the spinal dorsal horn. (A) Sham group; (B) CIPN-DMSO group; (C) CIPN-SB203580 group; (D) Fos positive neurons count (* vs Sham group, P < 0.05, # vs CIPN-DMSO group, P < 0.05, n = 4 per group). Bar: 100 μm.
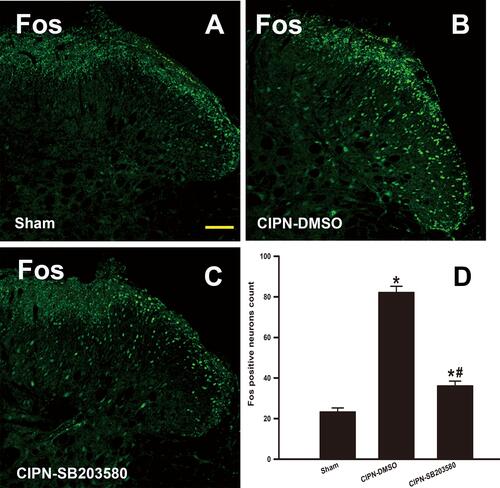
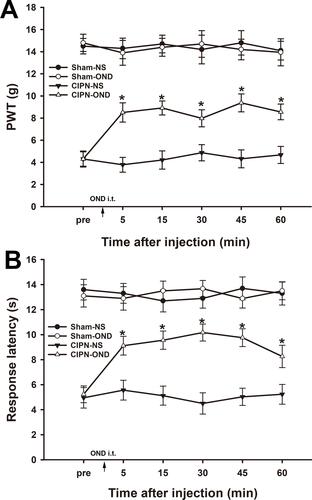
Figure 9 Intrathecal injection of ondansetron partially reversed chemotherapy-induced pain. Paw withdrawal thresholds (A) and paw withdrawal latencies (B) were significantly reversed from 5 min to 60 min after intrathecal injection of ondansetron in CIPN rats (* vs CIPN-NS group, P < 0.05, n = 6 per group).