Figures & data
Table 1 Basal and Intraoperative Characteristics Between Groups
Table 2 Incidence of Nausea and Vomiting Between Groups
Figure 1 The morphine consumption by patients using PCA during the first 12h after surgery in all groups. (A) In the cumulative dose of morphine at 12h is observed that Ketamine-magnesium (n=22) consumes significantly less morphine than control (n=21) and ketamine (n=20) groups (Kruskal–Wallis test and Dunn’s Multiple Comparison test: control vs ketamine-magnesium p<0.05 and ketamine vs ketamine-magnesium p<0.05). (B) Cumulative doses of morphine at 0 (PACU), 2, 6, and 12h show that ketamine-magnesium groups consume significantly less morphine at 6 and 12h (Two-way ANOVA and Bonferroni post hoc test, control vs ketamine-magnesium at 6 and 12h, p<0.05 and p<0.01; ketamine vs ketamine-magnesium 6 and 12h, p<0.05 and p<0.001). *p<0.05, **p<0.01, and ***p<0.001.
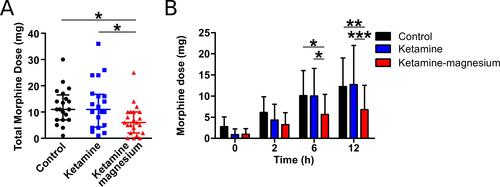
Figure 2 Time to the first morphine requirement of patients using PCA. The graph shows that patients of Ketamine-magnesium significantly delay more the first morphine dose than Control (ANOVA and Dunnett’s Multiple Comparison test: control vs ketamine-magnesium p<0.05). *p<0.05.
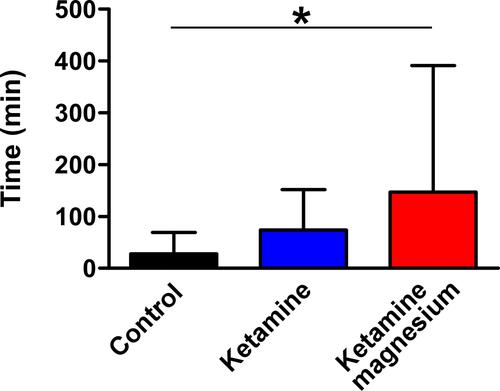
Figure 3 Pain score after surgery until 12 hours in all groups of patients. (A) In the pain score at rest, is observed that the Control group had more pain at 0h (PACU) than the other two groups (Two-way ANOVA and Bonferroni post hoc test, Control vs Ketamine and Control vs Ketamine-magnesium at 0h, p<0.05 and p<0.05). (B) In the dynamic pain score is shown that the Control group had more score of pain at 0h (PACU) than the Ketamine-magnesium group (Two-way ANOVA and Bonferroni post hoc test, Control vs Ketamine-magnesium at 0h, p<0.05). *p<0.05.
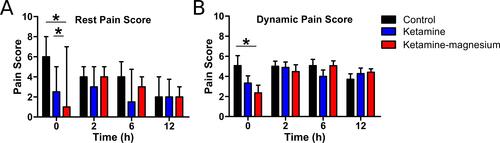
Figure 4 Multiple linear regression models for Pain score, Ratio Morphine Consumption, and Cumulative Morphine Consumptions between all groups. (A) Pain score, the Control group had higher pain from the Ketamine and the Ketamine-magnesium groups (p<0.001), whereas the Control group shows a higher decrease with the time than the other two groups (p<0.05). (B) Ratio Morphine Consumption, the Control group had higher consumption of morphine per hour than Ketamine and Ketamine-magnesium groups (p<0.001), which decay faster in the Control group than the other two groups (p<0.01). (C) Cumulative Morphine Consumption, The Control and the Ketamine groups accumulated more morphine than the Ketamine-magnesium group (p<0.01).
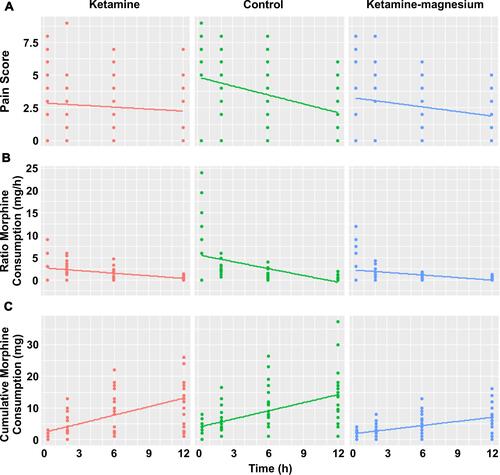
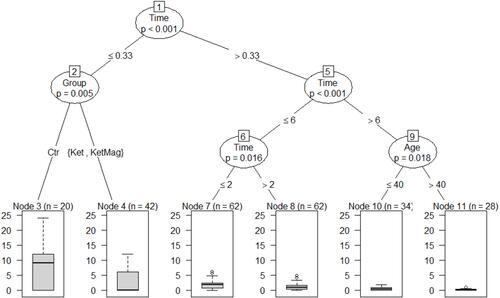
Figure 5 Regression tree analysis for Ratio Morphine Consumption between groups. Node 1 shows that morphine consumption per hour was higher during PACU (<0.33h) than after PACU stay (>0.33h) (p<0.001). In node 2 depicts that at PACU the Control group consumed more morphine per hour than the Ketamine and the Ketamine-magnesium groups (p=0.005). Node 5 and 6 show that morphine´s consume per hour decayed after 2h (p=0.016), and after 6h (p<0.001) of surgery. Finally, node 9 shows that patients older than 40 years old consumed less morphine per hour after 6h of surgery than younger patients (p=0.018).