Figures & data
Figure 1 Comparison of pain threshold and pain tolerance between control subjects (n = 16), methadone dependent subjects (n = 8), and buprenorphine dependent subjects (n = 8) among the four different pain modalities. (A–D) depict cold pain threshold, cold pain tolerance, ischemic pain threshold, and ischemic pain tolerance, respectively, using Kaplan–Meier survival curves. (E and F) represent the electrical stimulation threshold and tolerance and the mechanical pain threshold and tolerance, presented as the mean ± standard deviation.
Abbreviations: Meth, methadone-dependent subjects; Bup, buprenorphine-dependent subjects; C-TR, controls’ threshold; M-TR, methadone-dependent subjects’ threshold; B-TR, buprenorphine-dependent subjects’ threshold; C-TL, controls tolerance; M-TL, methadone-dependent subjects’ tolerance; B-TL, buprenorphine-dependent subjects’ tolerance.
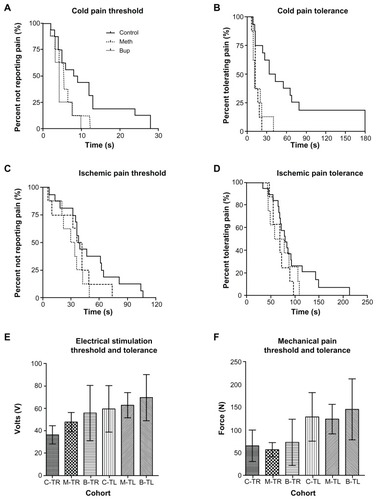
Table 1 Correlations between models