Figures & data
Table 1 Primers for RT-qPCR
Figure 1 Injection of CFA into the rat knee joint causes knee joint swelling and induces inflammatory joint pain. (A) Intra-articular injection of CFA significantly increased knee joint diameter on day 7 post-injection. (B) Intra-articular injection of CFA significantly decreased 50% PWT at the ipsilateral, but not contralateral, side on day 7 post-injection. *p < 0.05, **p < 0.01 vs the saline control group (n = 6 for each group).
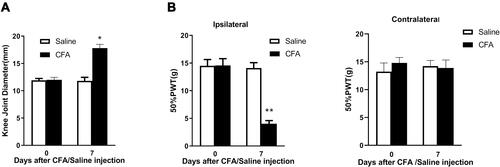
Figure 2 Intra-articular injection of CFA alters expression profiles of lncRNAs and mRNAs in the L4 and L5 DRGs on day 7 post-injection. (A and B) The scatter plots showed that a large number of lncRNAs (A) and mRNAs (B) were differentially expressed between CFA and saline groups. (C and D) The hierarchical cluster analysis of all lncRNAs (C) or mRNAs (D) showed that the 3 saline-treated and 3 CFA-treated samples were clustered together, respectively, and signal intensity was consistent in the saline or CFA group. (E and F) The heatmap showed that DE lncRNAs (E) or mRNAs (F) with either up-regulated or down-regulated twofold were magnified, indicating the high level of concordance in both saline-treated and CFA-treated samples.
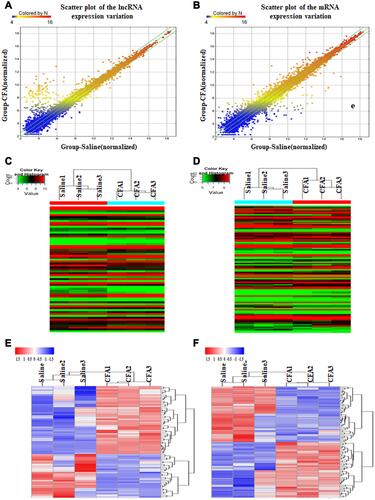
Table 2 The Detail Information of the Top 20 Up-Regulated and 20 Down-Regulated lncRNAs
Table 3 The Detail Information of the Top 20 uUp-Regulated and 20 Down-Regulated mRNAs
Figure 3 Distribution of various types of DE lncRNAs. Five classes (Intergenic lncRNAs, Sense lncRNAs, Antisense lncRNAs, Bidirectional lncRNAs, and other lncRNAs) were identified. In the 69 DE lncRNAs modulated by CFA-induced joint inflammation, we identified 20 Intergenic lncRNAs, 17 Sense lncRNAs, 10 Antisense lncRNAs, 1 Bidirectional lncRNAs, and 22 other type of lncRNAs.
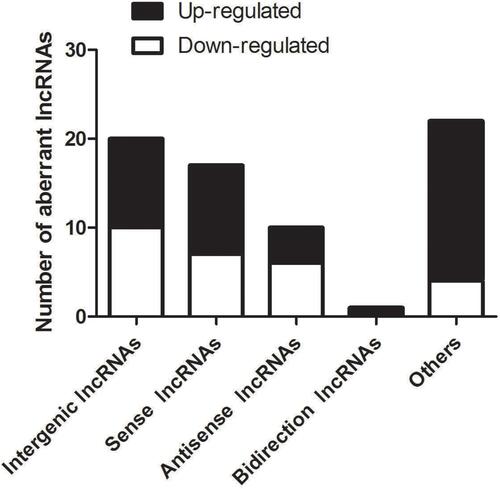
Figure 4 Quantitative real-time PCR validation of six regulated lncRNAs in the DRG and CNC network. (A and B) The expressions of MRAK163594 (A) and uc.247+ (B) were significantly increased on day 7 after intra-articular injection of CFA. (C−F) Four lncRNAs including uc.83- (C), XR_05599(D), NONRATT021972 (E), and AY321352 (F) were significantly decreased on day 7 after intra-articular injection of CFA. *p < 0.01, **p < 0.01, ***p < 0.001vs the saline control group (n =3 for each group, the error bars show SEM). (G) In the CNC network drawn with the Cytoscape (v2.8.1), pink circle nodes represent non-coding gene, green hexagonal nodes represent the coding gene, yellow star-marked verified lncRNA and as the predicted potential target, solid lines represent a positive correlation between the two nodes, and dotted lines represent negative correlation between the two nodes.
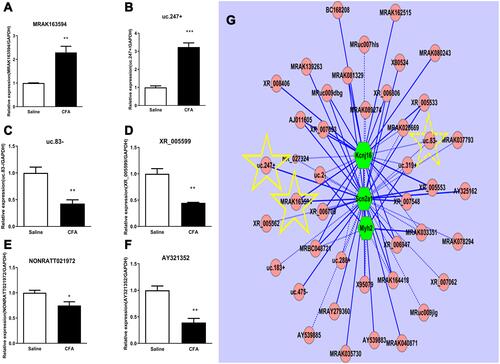
Figure 5 Biological functions analysis of DE mRNAs using GO. (A−C) The most significantly enriched molecular function (A), biological process (B), and cellular component (C) of up-regulated mRNAs after CFA-induced inflammatory joint pain. (D−F) The most significantly enriched molecular function (D), biological process (E), and cellular component (F) of down-regulated mRNAs after CFA-induced inflammatory joint pain.
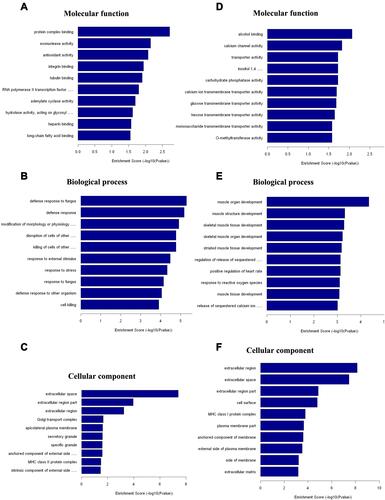
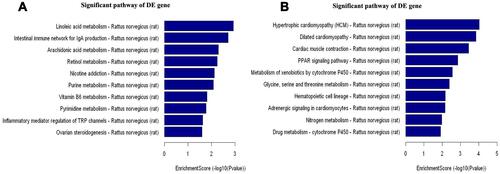
Figure 6 Pathway analysis for 51 up-regulated and 51 down-regulated mRNAs using KEGG. (A) The involved significant pathways for up-regulated genes in the CFA group. (B) The involved significant pathways for down-regulated genes in the CFA group.