Figures & data
Table 1 Demographic and Menstrual History Characteristics
Figure 1 Study enrollment flow diagram.
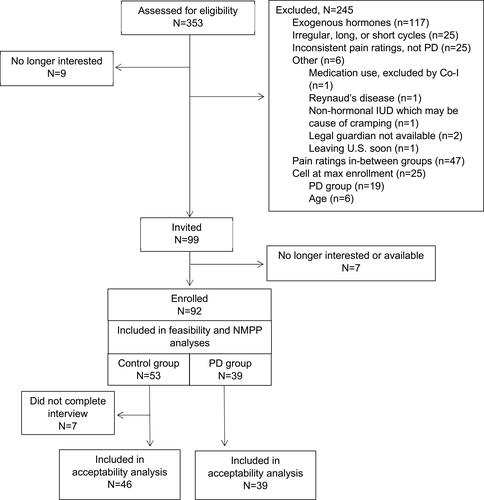
Table 2 Group Differences in Text Message and NMPP Data
Table 3 Breakdown of Numbers of Total Days and Non-Bleeding Days During Which Participants Received and Responded to Text Messages
Figure 2 Histogram of NMPP-% distribution within the whole sample.
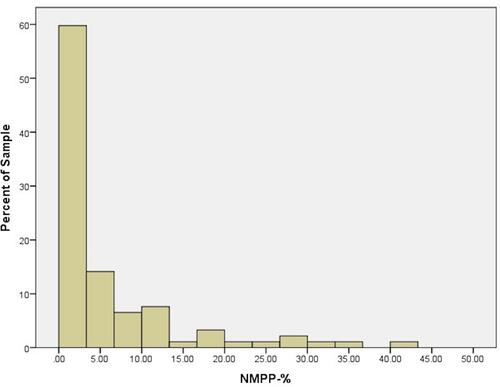
Figure 3 Histograms of NMPP-% distribution within the control group (A) and PD group (B).
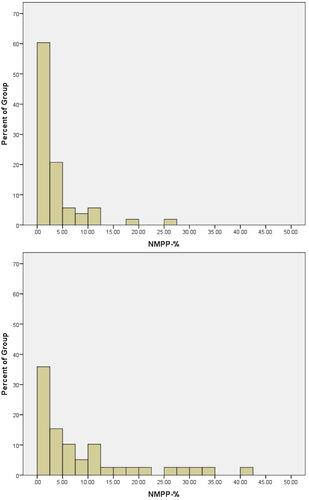
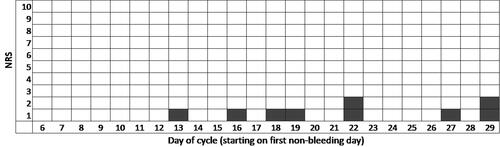
Figure 4 Example of cycle demonstrating low-level pelvic pain across the menstrual cycle.