Figures & data
Table 1 Participant Demographics
Figure 1 Distribution of pre- and post-class pain (A) and emotional distress (B), by group. Top row (panel (A)) indicates pre- and post-class pain. Bottom row (panel (B)) indicates pre- and post-class distress. The vertical axis indicates the portion of participants who reported pain or distress in each category. Only participants are shown who reported pre-class pain or distress (>0; N = 24 for pain, N = 18 for distress). Dashed bars indicate participants who reported no post-class pain or distress. Of note, post-class pain rating was missing for one participant (hemophilia patient), and post-class distress rating was missing for one participant (cancer patient).
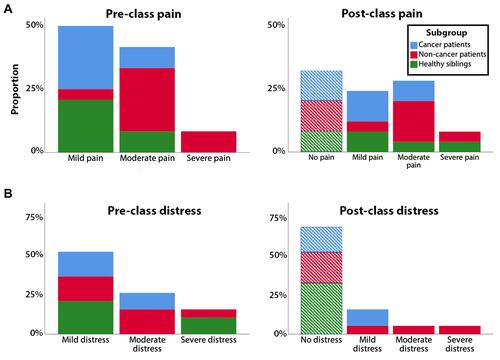
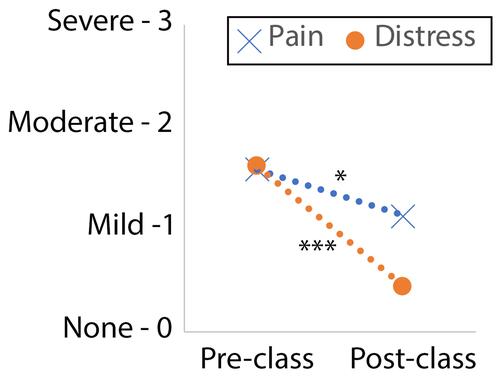
Figure 2 Significant reduction in pain and distress over the course of one class. Overall average of pre- and post-class pain and emotional distress. *p < 0.05, ***p < 0.001.