Figures & data
Figure 1 Characterization of hydrogel. (A) The optical images of the gelation progress. (B) Photo of ejecting hydrogel through a 22 G syringe needle from syringe without clogging. (C) Storage modulus (G′) and loss modulus (G′′) of hydrogel as a function of temperature. (D) Morphologies of hydrogel. (E) Morphologies of IFX-loaded hydrogel. (F) Quantitative statistics of undegraded hydrogel weight.
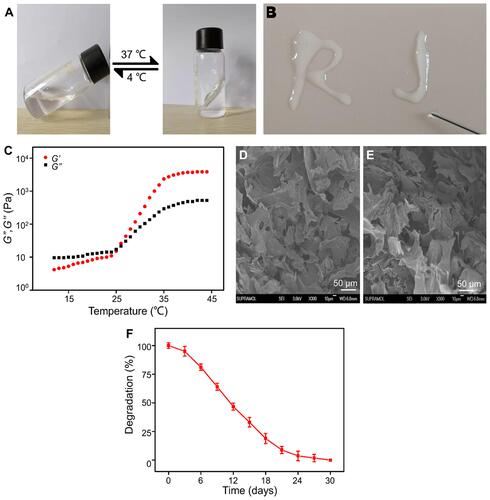
Figure 2 Cumulatively released IFX amount at each time point from hydrogel for 28 days.
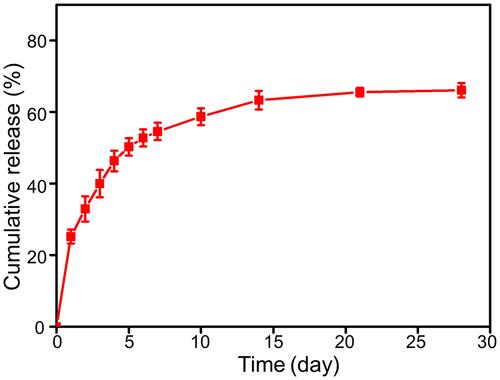
Figure 3 IFX-loaded hydrogel was biocompatible with chondrocytes. (A) The cell proliferation assay was studied with chondrocytes for 1, 4 and 7 days by CCK-8 assay. (B) Representative fluorescence microscopy images after live/dead staining of chondrocytes incubated for 4 day. (C) H&E staining showed no obvious inflammatory reaction in the surrounding muscles and subcutaneous tissues after subcutaneous injection of hydrogel.
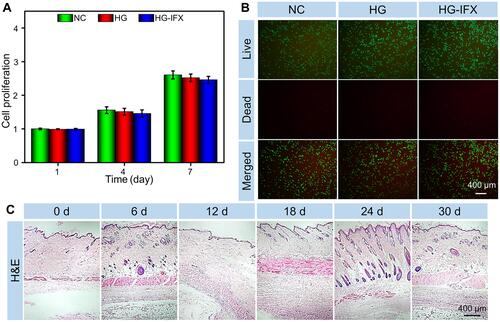
Figure 4 Measurements of (A) surface temperature and (B) joint diameter of left knee after induction of RA and injection of IFX-loaded hydrogel (*p < 0.05, **p < 0.01, ***p < 0.001 compared with HG-IFX, #p < 0.05 compared with NC).
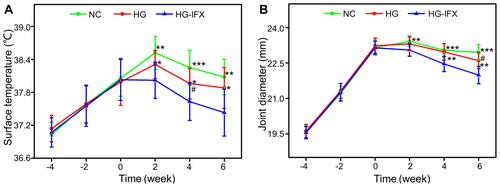
Figure 5 Changes of pain-related behavior after IFX-loaded hydrogel injection into the left knee joints. (A) Weight-bearing capacity was calculated by weight-bearing index (WBI). (B) Paw withdrawal threshold (PWT) was measured to test mechanical allodynia (*p < 0.05).
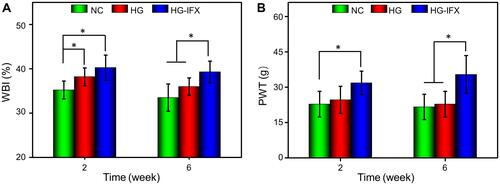
Figure 6 Macroscopic morphology and histological analyses of articular cartilage destruction. (A) Typical appearance of articular cartilage surface 6 weeks after implantation. (B) H&E, (C) Toluidine blue, and (D) Safranin O-fast green staining of articular cartilage 6 weeks after implantation. Red arrows indicate the necrotic tissue on the surface of cartilage. (E) Immunohistochemical staining of COL I and COL II of articular cartilage 6 weeks after injection. (F) Ratio of COL II versus COL I calculated in the cartilage (*p < 0.05, **p < 0.01).
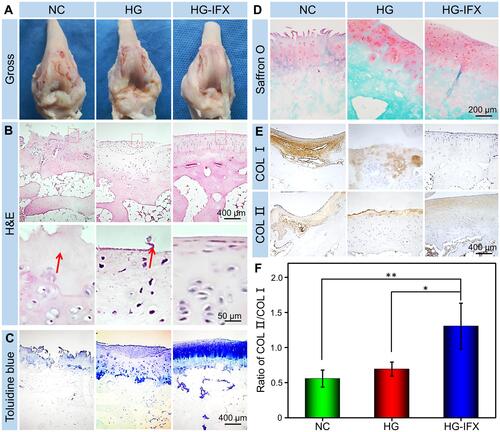
Figure 7 Improvement of synovial inflammation treated with IFX-loaded hydrogel. Typical synovium in each group stained with H&E at 6 weeks post-injection (red arrows indicate synovial hyperplasia and inflammatory cell infiltration).
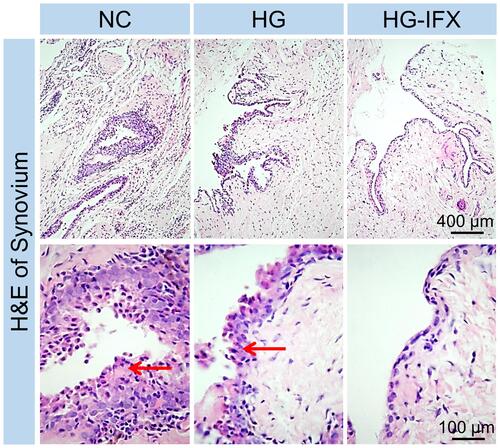
Figure 8 IFX-loaded hydrogel inhibited inflammatory cytokines expression in synovial fluid. The levels of inflammatory cytokines derived from synovial fluid of RA rabbits treated with saline, HG and HG-IFX at (A) 2 weeks and (B) 6 weeks post-injection (*p < 0.05, **p < 0.01, ***p < 0.001).
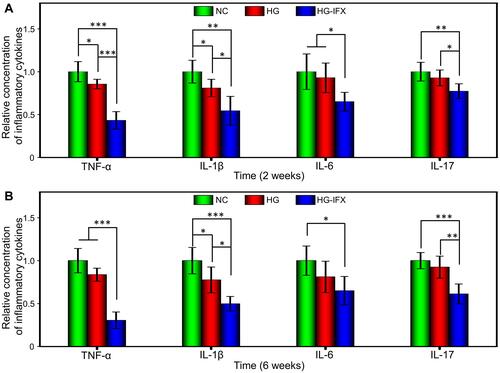
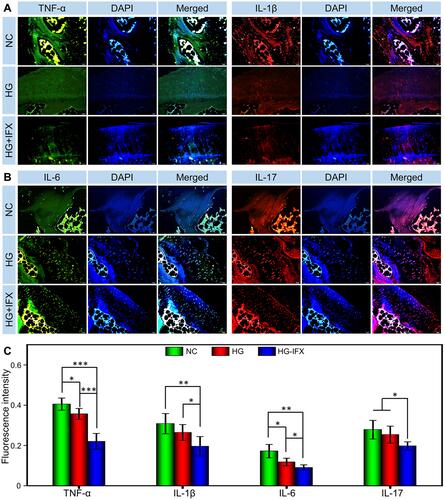
Figure 9 Inhibiting inflammatory cytokines expression in cartilage. Representative immunofluorescence images of (A) TNF-α and IL-1β, (B) IL-6 and IL-17 expression in cartilage 6 weeks post-injection. (C) Quantitative statistics of TNF-α, IL-1β, IL-6 and IL-17 expression in cartilage 6 weeks post-injection (*p < 0.05, **p < 0.01, ***p < 0.001).