Figures & data
Figure 1 Curcumin alleviated mechanical allodynia induced by cobra venom intra-ION injection. (A) Schematic for the timeline of surgery (cobra venom or sterile saline injection) and curcumin administrations. (B) Mechanical allodynia induced by cobra venom intra-ION injection was attenuated by curcumin treatment. Two-way ANOVA, *P<0.05 vs the sham group, #P<0.05 vs the cobra venom group, n=8 or 9.
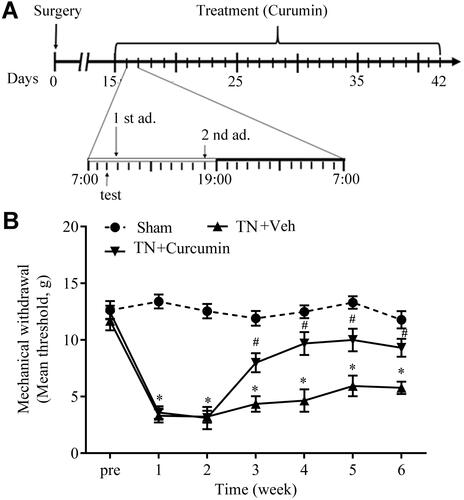
Figure 2 The effects of curcumin treatment on depression behaviors observed in rats with chronic pain. (A) Sucrose preferences were progressively reduced in rats with TN, and recovered by curcumin treatment. (B) Immobility time during forced swimming were progressively increased in rats with TN and normalized after curcumin treatment. Two-way ANOVA, *P<0.05 vs the sham group, #P<0.05 vs the cobra venom group, n=8 or 9.
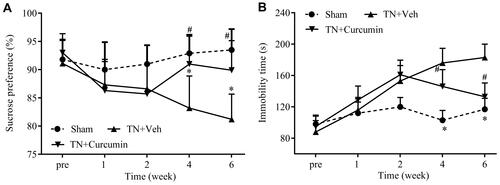
Figure 3 Score-Plot of principal component analysis for different groups of rats. (A) Score-Plot of PCA for the serum samples collected from different groups 6 weeks after surgery. Black, sham group; Red, TN+vehicle group; and Blue, TN+curcumin group. (B) Score-Plot PCA for the serum samples collected at different time points after cobra venom intra-ION injection. Green, week 1; Orange, week 2; Grey, week 4; and Violet, week 6.
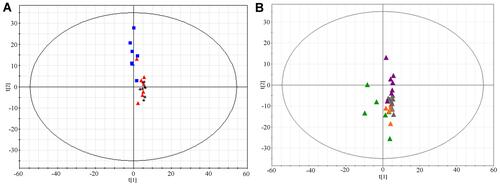
Figure 4 Partial least-squares discriminant analysis of metabolomics data in different experimental groups. (A) Score plot. Black, sham group; Red, TN group, and Blue, TN+ curcumin group. (B) 100-permutation test. (C) loading plot. (D) VIP value plot.
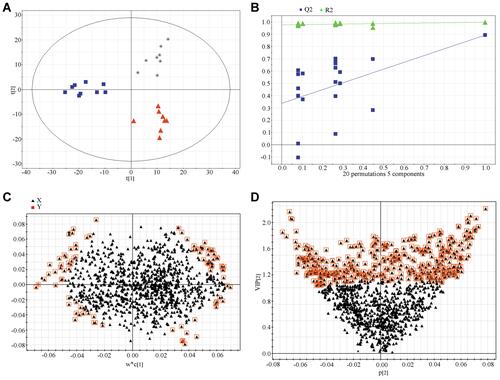
Table 1 Identified Metabolites from the Serum Collected at Different Time Points After Venom Cobra Intra-ION Injecton
Figure 5 Serum metabolic profiling. (A) Heatmap of metabolic profiles at different time points after cobra venom intra-ION injection. (B) Heatmap of metabolic profiles in different groups of rats.
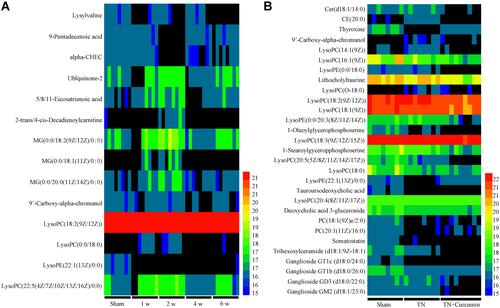
Table 2 Identified Metabolites from the Serum Collected from TN Rats Received Curcumin Treatment or Vehicle
Figure 6 Pathway enrichment analysis of metabolites changed by curcumin treatment. (A) Pathway analysis of the effects of curcumin treatment on (a) Ether lipid metabolism, (b) Glycerophospholipid metabolism, (c) Pentose and glucuronate interconversions, and (d) Starch and sucrose metabolism in TN rats. (B) Glycerophospholipid metabolism (C04598: 2-Acetyl-1-alkyl-sn-glycero-3-phosphocholine, C04317: 1-Alkyl-2-lyso-sn-glycero-3-phosphocholine). (C) Ether lipid metabolism (C00157: Phosphatidylcholine, C04230: 1-Acyl-sn-glycero-3-phosphocholine. C03033: Glucuronide). (D–F) The enrichment pathway analysis of the effects of curcumin treatment in TN rats.
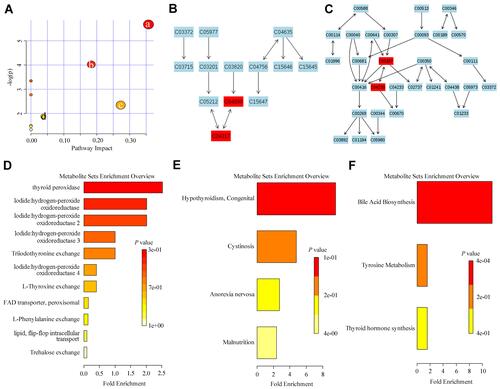
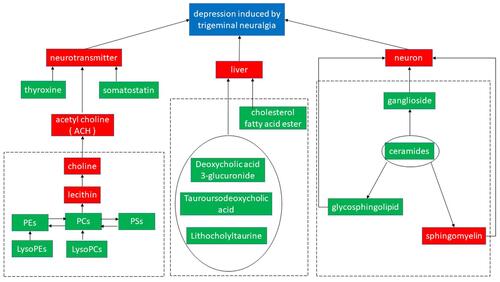
Figure 7 The effects of curcumin treatment on the expression of serum metabolite in TN rats. Differentially expressed metabolite pathways and their associated signaling networks (potential biomarkers were labeled by green solid box.).