Figures & data
Table 1 MSQ Scores at Baseline
Figure 1 Monthly LS mean change in MSQ-RFR scores from baseline. Washout period denoted by gray shading. Patients had the option of entering an open-label extension period after Month 6. Number of patients at Month 10 reflects this option: n=98 for PBO, n=51 for GMB 120 mg, and n=51 for GMB 240 mg. *P<0.05 vs PBO (MMRM analysis). The average LS mean change from baseline over Months 4–6 in MSQ-RFR was 10.12±0.72 for PBO, 7.13±1.03 for GMB 120 mg, and 15.91±1.03 for GMB 240 mg.Citation16 The MMRM model included the fixed categorical effects of treatment, month, and treatment-by-month interaction, the baseline number of monthly migraine headache days (<8, ≥8), and the continuous fixed covariates of baseline value and baseline-by-month interaction.
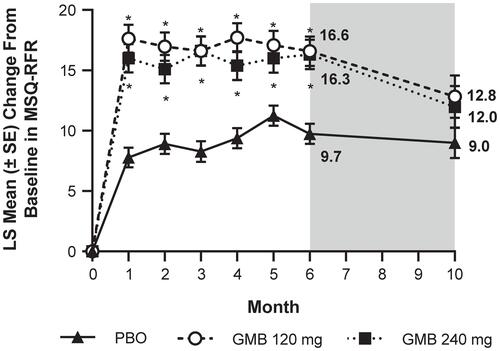
Table 2 MSQ-RFR Responders by Treatment Group
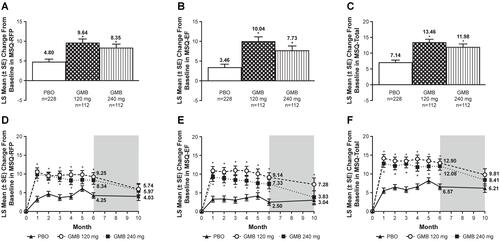
Figure 2 LS mean changes from baseline in additional MSQ scores. Bar graphs: average LS mean change from baseline over Months 4–6 in (A) MSQ-RFP, (B) MSQ-EF, and (C) MSQ-Total scores. Line graphs: monthly LS mean changes from baseline in (D) MSQ-RFP, (E) MSQ-EF, and (F) MSQ-Total scores. Washout period denoted by gray shading. Patients had the option of entering an open-label extension period after Month 6. Number of patients at Month 10 reflects this option: n=98 for PBO, n=51 for GMB 120 mg, and n=51 for GMB 240 mg. *P<0.05 vs PBO (MMRM analysis). The MMRM model included the fixed categorical effects of treatment, month, and treatment-by-month interaction, the baseline number of monthly migraine headache days (<8, ≥8), and the continuous fixed covariates of baseline value and baseline-by-month interaction.