Figures & data
Figure 1 Experimental design. WT female C57BL/6J mice aged 8 weeks and weighing 20–25 g were subjected to saline or oxaliplatin injection. Hydrogen-rich or normal drinking water was used for the entire experiment. One day before the OXA or saline injection (on day 0), the solubility of H2 in normal or hydrogen-rich water was detected at 0, 5, 10 and 30 min, and 1, 12 and 24 h after blowing the hydrogen gas into the drinking water. PWMT was carried out 1, 5, 10, 15 and 20 days after the saline or oxaliplatin injection. The feces of different groups were obtained for tests following PWMT test. The DRG and spinal cords of L4-6 segments and serum of different groups were obtained for tests following feces collection on day 20. Different groups of DRG, spinal cords and serum were used for ELISA, and DRG and spinal cords were used for Western blot analysis, as mentioned in the Materials and Methods section.
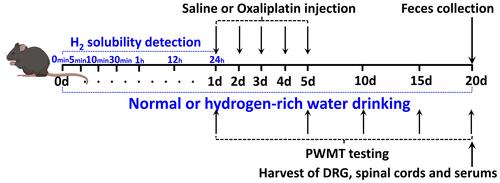
Figure 2 Solubility of H2 in normal and hydrogen-rich water at different time points. The solubility of H2 in normal or hydrogen-rich water was detected at 0, 10 and 30 min, and 1, 12 and 24 h after blowing the hydrogen gas into the drinking water. The flow rate of H2 was 400 mL/min at the first 10 min and 100 mL/min from 10 min to 24 h. The H2 solubility was measured three times at each time point. H2, molecular hydrogen. *P<0.05 vs H2O group.
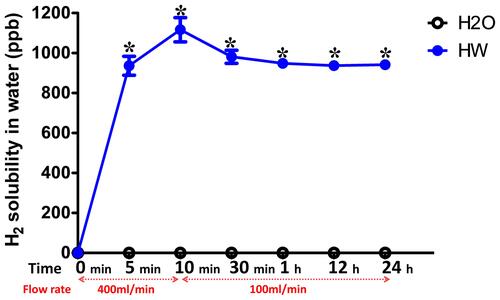
Figure 3 Effects of hydrogen-rich water on paw withdrawal mechanical threshold in CINP mice. Mice were treated with hydrogen-rich or normal drinking water and injected with saline or oxaliplatin for the duration of the experiment. Values are presented as PWMT between the (A) H2O + Saline and HW + Saline and (B) H2O + OXA and HW + OXA groups (n=10 mice per group). *P<0.05 vs H2O + OXA group.
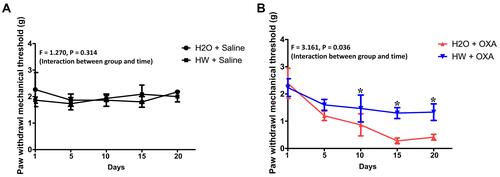
Figure 4 Effects of hydrogen-rich water on richness and α-diversity of microbiota communities in the feces of CINP mice. Fecal samples were obtained on day 20 from mice fed with hydrogen-rich or normal drinking water and injected with saline or oxaliplatin. The plotted data are presented as the mean ± SD of the (A) coverage, (B) Shannon and (C) Simpson indices. *P<0.05 vs H2O + Saline; #P<0.05 vs H2O + OXA (n=6 mice per group).
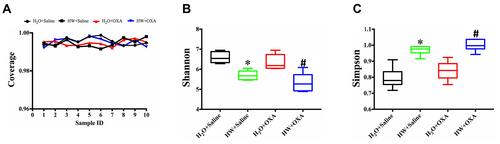
Figure 5 Effects of hydrogen-rich water on species composition and changes of microbiota communities in the feces of CINP mice. Fecal samples were obtained on day 20 from mice fed with hydrogen-rich or normal drinking water and injected with saline or oxaliplatin. (A–C) Relative abundance of intestinal microbiota at the (A) phylum, (B) family and (C) genus levels in different groups (n=6 mice per group).
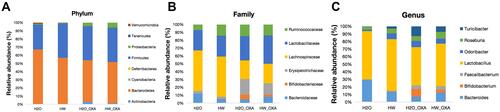
Figure 6 Effects of hydrogen-rich water on the expression of inflammatory cytokines and oxidative stress indicators in the DRG, spinal cords and serum of CINP mice. The pro-inflammatory cytokines (A) TNF-α and (B) IL-6, and oxidative stress indicators (C) OH− and (D) ONOO− were measured in DRG, spinal cords and serum of mice by ELISA in each group (n=5 mice per group). *P<0.05 vs H2O + Saline group; &P<0.05 vs HW + Saline group; #P<0.05 vs H2O + OXA group.
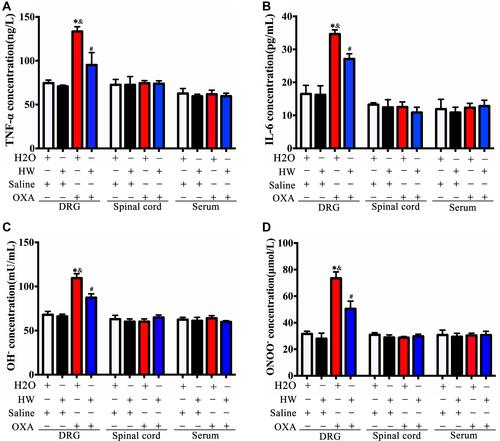
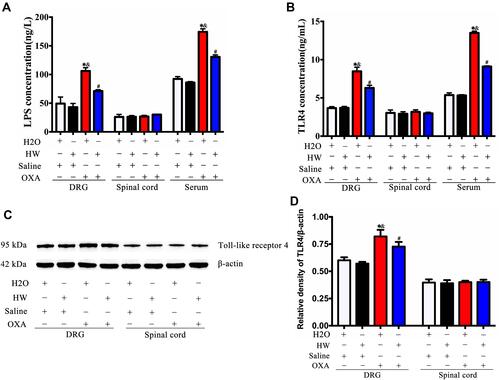
Figure 7 Effects of hydrogen-rich water on the expression of LPS and TLR4 in CINP mice. (A) The expression of LPS was detected in the DRG, spinal cords and serum of mice by ELISA in each group. (B) The expression of TLR4 was detected in the DRG, spinal cords and serum of mice by ELISA in each group. (C) The expression of TLR4 was detected by Western blot analysis. (D) Quantitative analysis of TLR4 is presented as the ratio of band density to that of β-actin. n=5 mice per group. *P<0.05 vs H2O + Saline group; &P<0.05 vs HW + Saline group; #P<0.05 vs H2O + OXA group.