
Figures & data
Table 1 Characteristics of the Respondents
Table 2 Prevalence of Falls by Sex and Age
Table 3 Point Prevalence of Musculoskeletal Pain by Anatomical Site, Sex and Age
Figure 1 The prevalence of musculoskeletal pain by site. This figure shows the point prevalence of musculoskeletal pain among pilgrims. The results are presented as frequencies and percentages for each site.
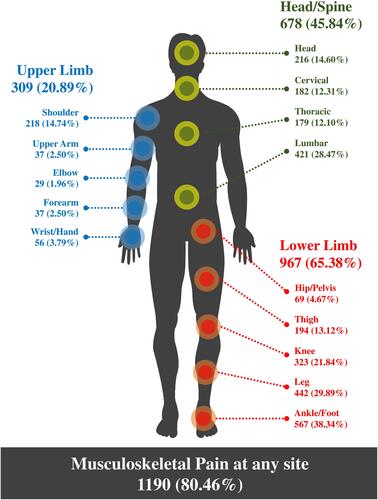
Table 4 Risk Ratios for Overall (Pain at Any Site) and Total Lower Limb (Pain in the Hip/Pelvis, Thigh, Knee, Leg and Ankle/Foot) Musculoskeletal Pain in the Hajj Population by Sex, Age and BMI
Table 5 Risk Ratios for the Most Common Sites of Musculoskeletal Pain in the Hajj Population by Sex, Age and BMI
Table 6 Association Between Ankle/Foot Pain and Pain in the Leg, Knee and Lower Back