Figures & data
Figure 1 Resting orthosis.
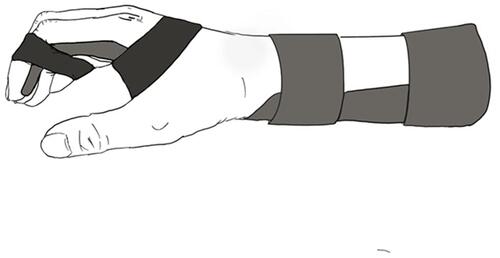
Figure 2 Dynamic orthosis.
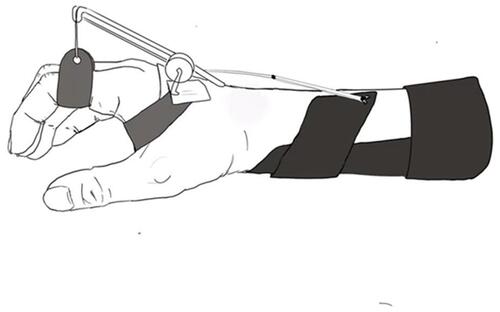
Figure 3 Orthosis of limit the radioulnar movement. (A) Elastic plastic material displayed in yellow. (B) Rigid material displays in gray and has a pully at MCP.
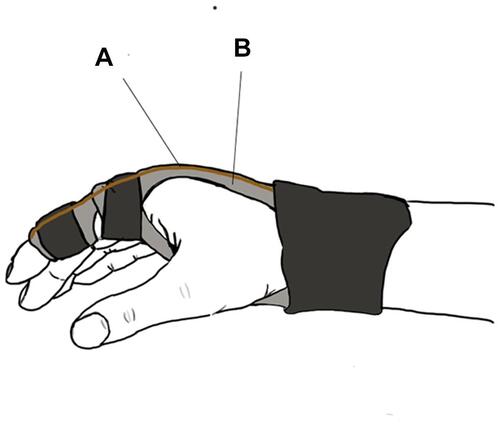
Table 1 Preoperative Data
Table 2 Postoperative and Follow-Up Function of the Two Groups
Figure 4 Correction between DASH scores and MCP joint ROM at postoperation.
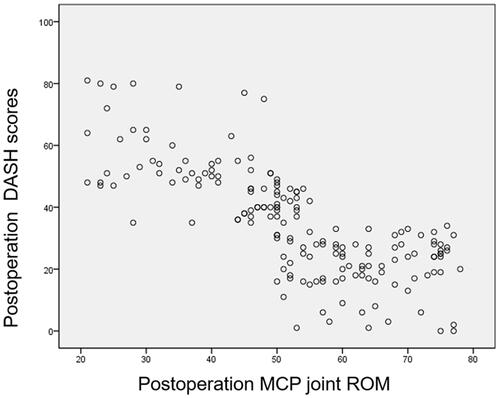
Figure 5 Correction between DASH scores and grip index at postoperation.
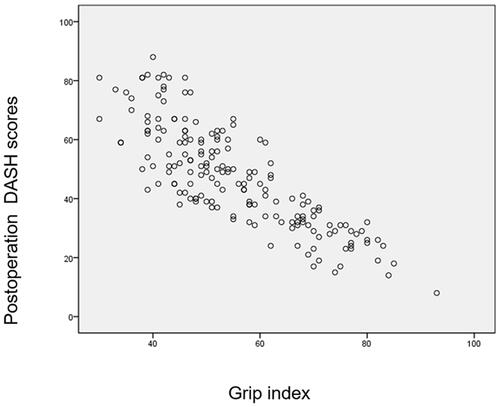
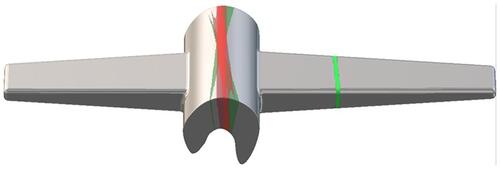
Figure 6 Typical implant fracture models in group A.
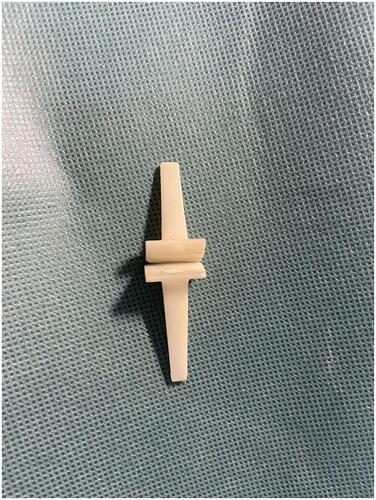
Figure 7 Typical implant fracture models in group B.
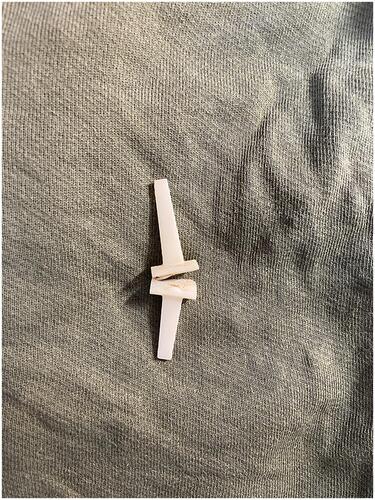
Figure 8 Stress model; The green line is the fracture position of the implant in group B, and the red line is in group A. The darker the color, the more frequent fractures.