Figures & data
Table 1 Demographic and clinical characteristics of the patients (A) with pain, (B) without pain and (C) healthy volunteers
Table 2 Results of the Douleur Neuropathique 4 questionnaire
Figure 1 Area of tactile hypoesthesia (numbness).
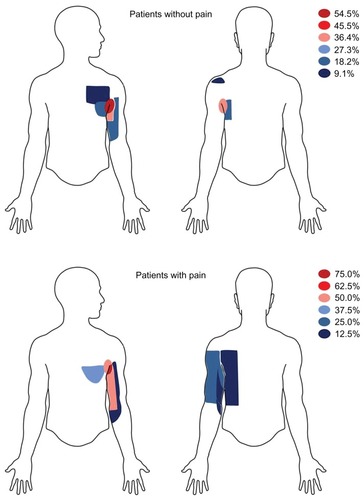
Figure 2 Grand average global field power (GFP) and corresponding topographic representations. (A) Grand average GFP (N = 30). The dotted lines indicate peak latency of the different event-related potential (ERP) components. Four different components can be identified: a negative voltage between 110–180 ms, maximal at FCz, labeled as N150, a positive voltage between 190–230 ms, maximal at Cz, labeled as P200, a positive voltage between 250–310 ms, maximal at FCz, labeled as P260, and a positive voltage between 310–380 ms, maximal at Cz and labeled as P350. (B) Topographic representations of the ERP components at the ERP latencies (N = 30). To best illustrate the maximal activity in each representation, we adjusted the scale to its maximal absolute values (for increases and decreases in voltages). As a result the scale differs between the different representations and is therefore left out.
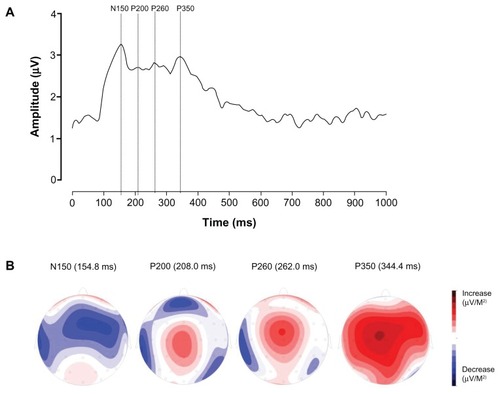
Figure 3 Group-specific topographic representations. Shown are the topographic representations of the different event-related potential (ERP) components at the different ERP latencies ().
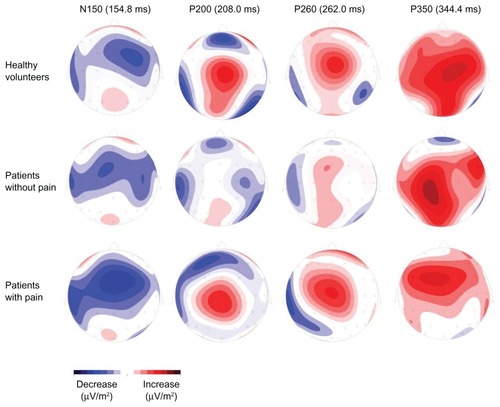
Figure 4 Event-related potential (ERP) waveforms. Grand average ERPs observed from FCz showing the P260 differences (A) effect of treatment, (B) effect of pain.
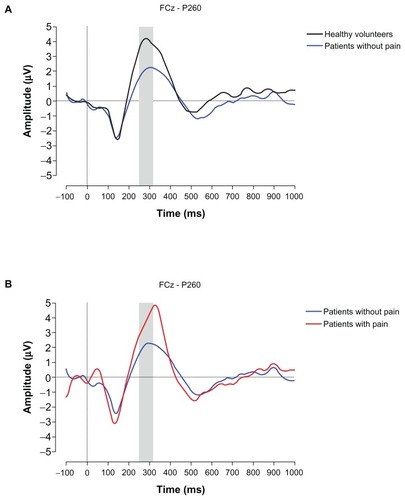
Table 3 Event-related potential (ERP) amplitude and latencies