Figures & data
Figure 1 Flow chart of study retrieval and selection process.
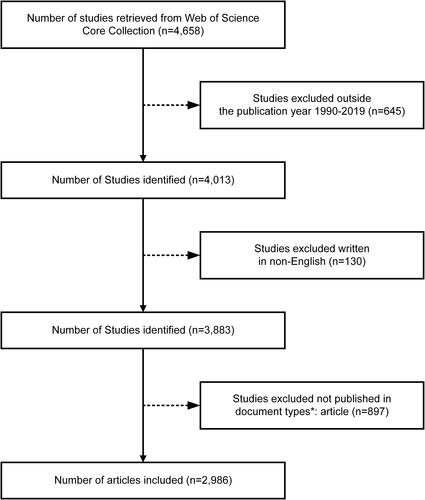
Figure 2 Number of total publications and citations by year.
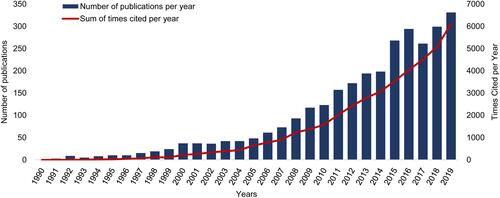
Figure 3 World map of countries/regions based on research on herbal medicine for pain.
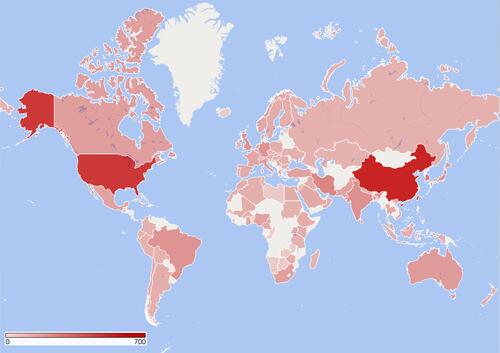
Table 1 Top 10 Countries/Regions with the Highest Number of Publications, Citation Score, and Centrality
Figure 4 Collaboration network between countries/regions.
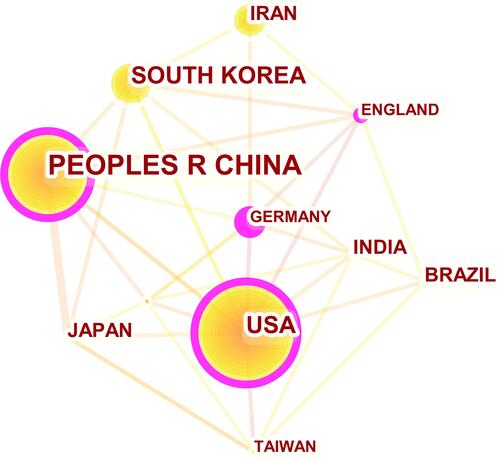
Table 2 Top 10 Most Productive and Active Institutions
Figure 5 Collaboration networks of the institutions.
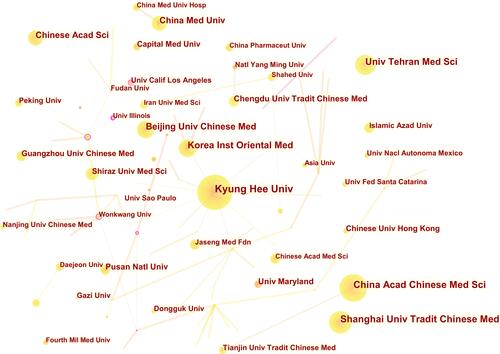
Table 3 Top10 Most Productive and Cited Authors
Figure 6 Dual-map overlay of journals related to studies on herbal medicine for pain.
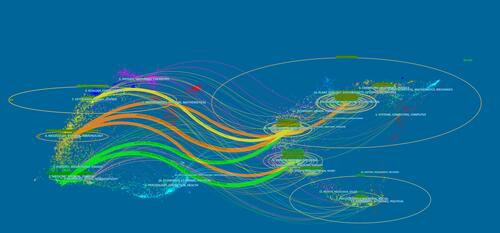
Table 4 Top 10 Most Productive Journals and Research Domain of Each Journal
Figure 7 Steam graph of the top 10 research areas.
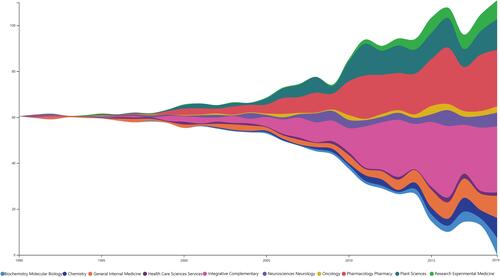
Figure 8 Characteristics of intellectual structure. (A) A network of co-cited references about research on herbal medicine for pain. (B) Cluster view of co-cited references from publications between 1990 and 2019.
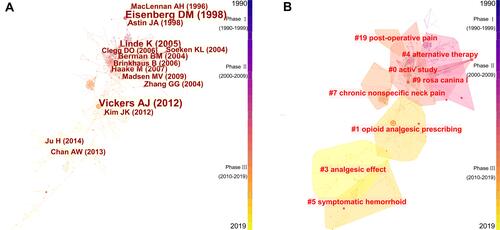
Table 5 The 10 Most Cited References in Each Phase
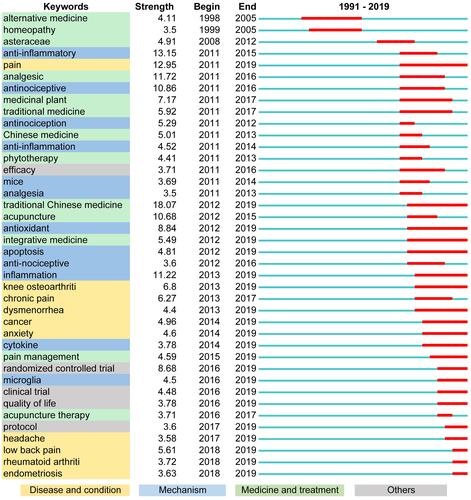
Figure 9 Top 40 keywords with citation bursts related to herbal medicine for pain from 1990 to 2019.