
Figures & data
Figure 1 CONSORT flow diagram of the trial for primary outcomes.
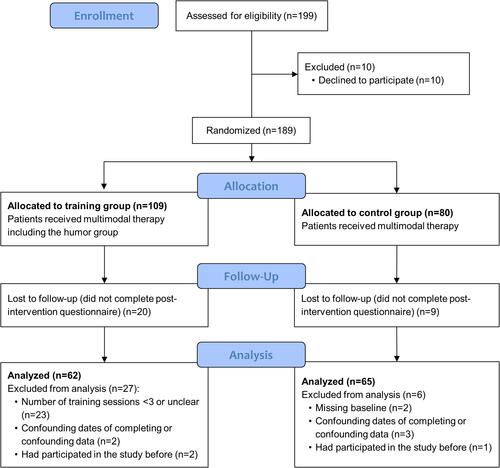
Table 1 Overview of the Humor Training
Table 2 Means, Standard Deviations, and Effect Sizes of Primary and Secondary Outcomes for Training and Control Group
Table 3 Main Effects and Group by Time Interaction for Training vs Control Group
Table 4 Means and Standard Deviations of Feedback Items for Participants of the Training Group (n = 52)
Table 5 Codings for Answers on Open Feedback Questions by Participants of the Training Group (n = 43)