Figures & data
Table 1 VAS Values of Median, First and Third Quartiles for Different Observation Points
Figure 1 Patient distribution based on the Lequesne Index of severity for osteoarthritis.
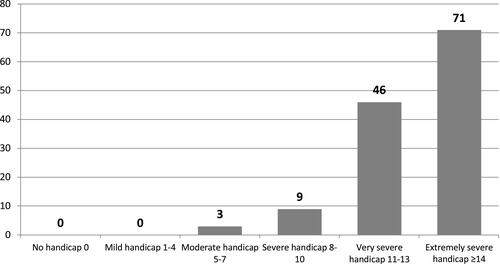
Figure 2 Box plot of median, first and third quartile of VAS values at different observation points.
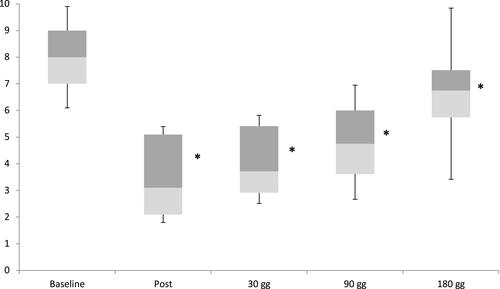
Figure 3 Pain relief related to the various disabled classes obtained using Lequesne classification.
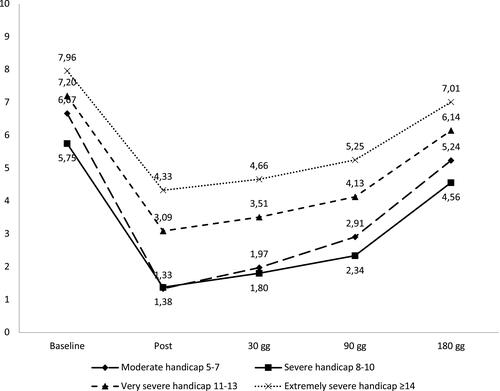
Figure 4 VAS values compared between patients treated under fluoroscopic guidance vs sonographic guidance.
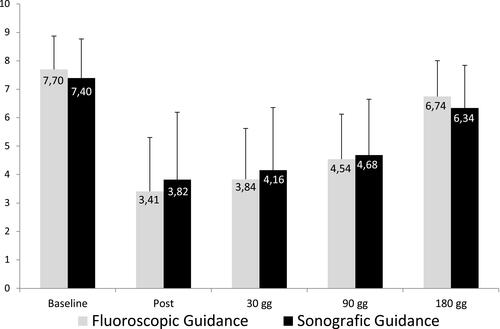
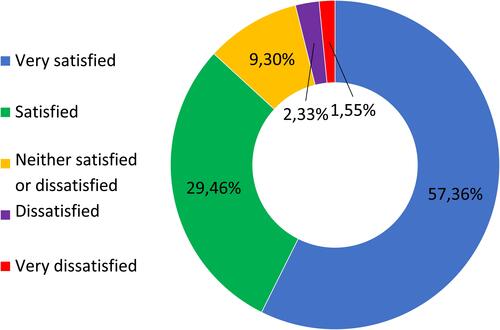
Figure 5 Patients satisfaction recorded 180 days after procedure.