Figures & data
Figure 1 (A) Experimental design. (B and C) Effects of tDCS on mechanical allodynia (presented by PWT) and thermal hyperalgesia (presented by PWL) in MIA-induced chronic pain rats were shown in the figure. Compared with the Sham group, there were significant decreases on PWT and PWL from 1 to 35 days after MIA injection. After tDCS treatment, PWT and PWL dramatically increased compared with the MIA group, but no difference was observed between the MIA and MIA+StDCS groups. Data were presented as the mean ± SEM, (n=6/group). ****P<0.0001 represented comparison of MIA with Sham group; #P<0.05, ###P<0.001, ####P<0.0001 represented comparison of MIA+tDCS with MIA group. (D and E) Effects of Ifenprodil on tDCS in improving mechanical allodynia (presented by PWT) and thermal hyperalgesia (presented by PWL). The PWT and PWL in MIA+PBS (i.c.v.)+tDCS as well as MIA+Ifenprodil (i.p.)+tDCS groups increased significantly, but these changes did not appear in MIA+Ifenprodil (i.c.v.)+tDCS group. There was significant difference in PWT and PWL between the MIA+PBS (i.c.v.)+tDCS and the MIA+Ifenprodil (i.c.v.)+tDCS groups. Data were presented as the mean ± SEM, (n=6/group). &&P<0.01, &&&&P<0.0001 represented comparison of MIA+PBS (i.c.v.)+tDCS with MIA+Ifenprodil (i.c.v.)+tDCS group.
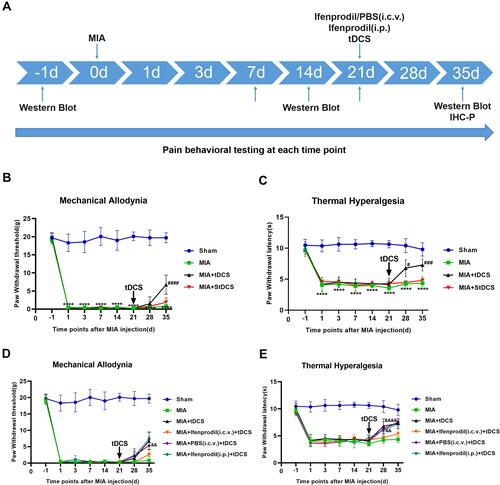
Figure 2 (A) Effect of MIA on NMDAR2B protein in the PAG by Western blot analysis. Data were presented as the mean ± SEM (n= 3/group). ***P<0.001, represented comparison of 7 days, 14 days and 21 days after MIA injection with 1 day before MIA injection. (B) The expression of NMDAR2B protein in the PAG was measured at 14 days after tDCS treatment. Data were presented as the mean ± SEM (n=3/group). ***P<0.001, MIA group vs Sham group; ###P<0.001, MIA+tDCS group vs MIA group. (C) The expression of NMDAR2B protein in the PAG was measured at 14 days after tDCS treatment. Data were presented as the mean ± SEM (n=3/group). ***P<0.001, MIA group vs Sham group; ###P<0.001, MIA+tDCS group vs MIA group; &&P<0.01, MIA+PBS (i.c.v.)+tDCS vs MIA+Ifenprodil (i.c.v.)+tDCS group.
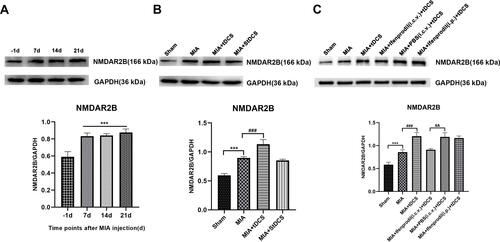
Figure 3 Immunohistochemical staining for NMDAR2B in all groups. Scale bars: 200 µm. The proportion of positive stained cells were presented as the mean ± SEM (n=4/group). ****P<0.001, MIA group vs Sham group; ###P<0.001, MIA+tDCS group vs MIA group; &&P<0.01, MIA+PBS (i.c.v.)+tDCS vs MIA+Ifenprodil (i.c.v.)+tDCS group.
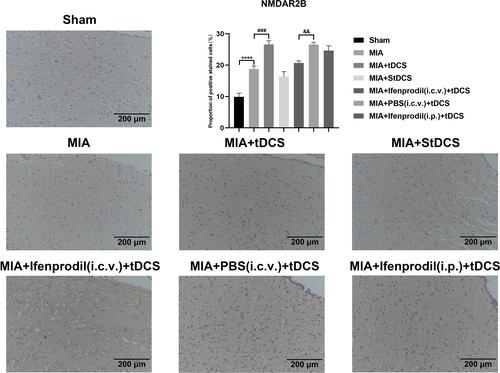
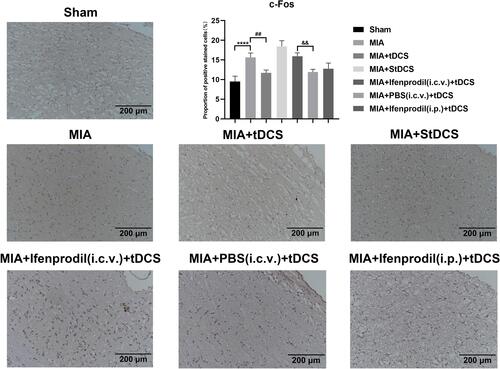
Figure 4 Immunohistochemical staining for c-Fos in all groups. Scale bars: 200 µm. The proportion of positive stained cells were presented as the mean ± SEM (n=4/group). ****P<0.001, MIA group vs Sham group; ##P<0.01, MIA+tDCS group vs MIA group; &&P<0.01, MIA+PBS (i.c.v.)+tDCS vs MIA+Ifenprodil (i.c.v.)+tDCS group.