
Figures & data
Figure 1 The picture shows the distribution of the skin nodes in the innervated area, and the distribution of the nerve skin nodes involving C3-8 in herpes zoster patients is located in one limb.
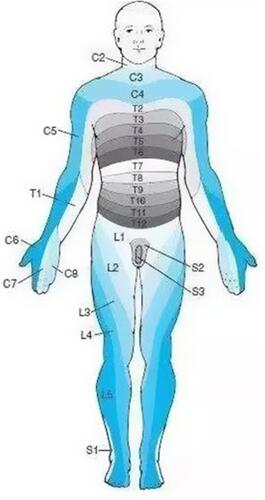
Figure 2 The patient was laid in a lateral position healthy side down on the CT imaging bed. The positioning grid was fixed on the neck of the affected side with adhesive tape.
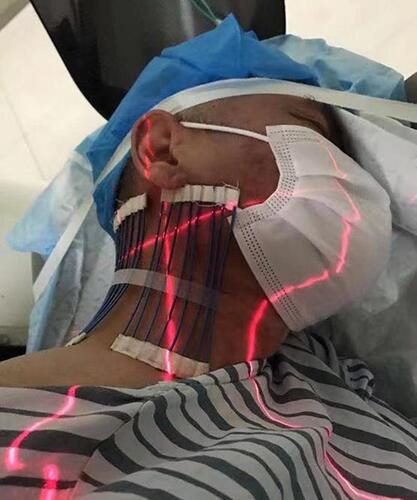
Figure 3 The intervertebral foramen and vertebral artery foramen can be displayed on the same plane. The dorsal point of the foramen was selected as the target point. The orientation of the positional line was parallel to the pedicle of the foramen and the intersection of the extension line and the skin is the needle insert point.
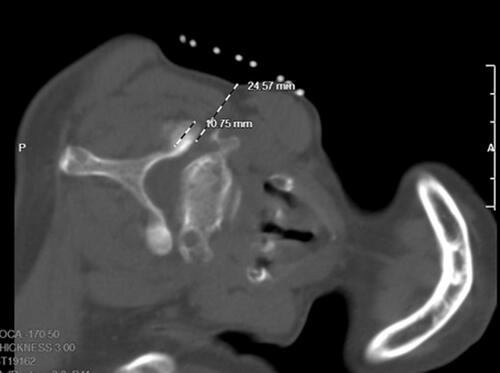
Figure 4 First step we try to put the tip to the target of anterior nodule of the foramina, vertebral artery showed at the same plane.
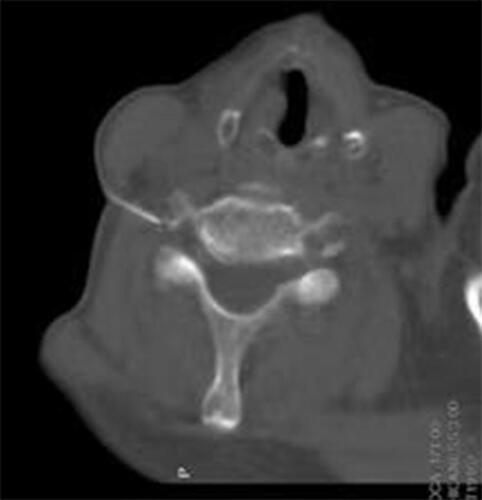
Figure 5 Second step we insert the Radiofrequency needle along the line path, and the depth was not deeper than 1/2 of the upper articular surface.
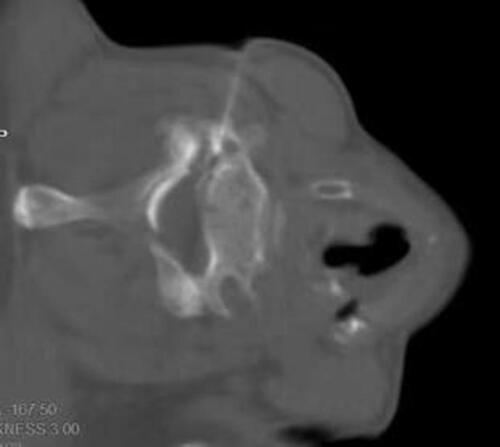
Figure 6 These was injected followed by ozone (40ug/mL) for 3mL each segments, this picture showed ozone spread in the epidural space and around the artery.
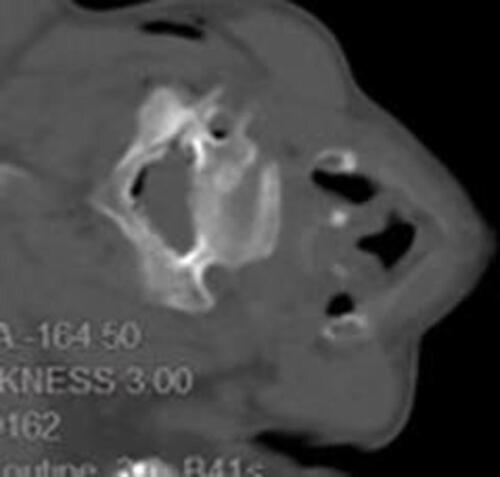
Table 1 Baseline Characteristics of Patients
Table 2 Study Population Summary Statistics
Table 3 Comparison of Preoperative and Postoperative NRS (T0: Preoperation NRS; T1: At Once NRS; T2: 2 Week NRS; T3: 4 Week NRS; T4: 12 Week NRS)
Table 4 Comparison of Preoperative and Postoperative Medication
Figure 7 Comparison of preoperative and postoperative NRS (T0: preoperation NRS; T1: at once NRS; T2: 2 week NRS; T3:4 week NRS; T4: 12 week NRS).
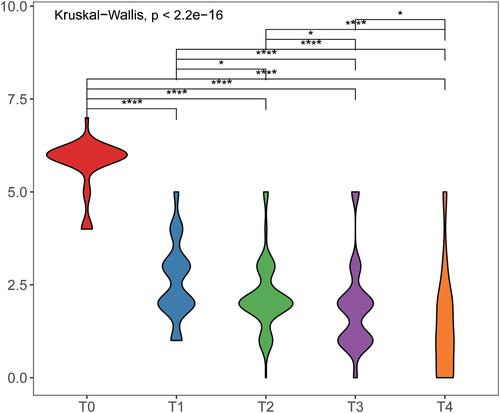
Figure 8 Comparison of preoperative and postoperative medication.
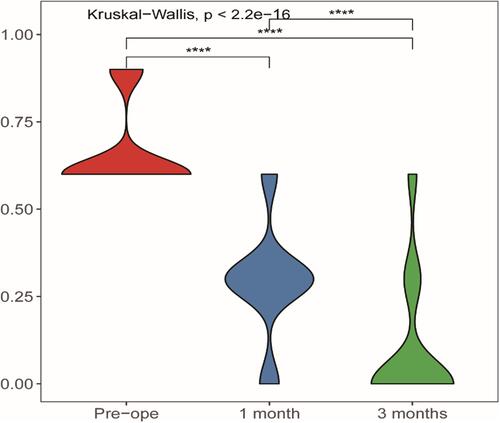
Table 5 Intraoperative and Postoperative Complications