Figures & data
Figure 1 The experimental design.
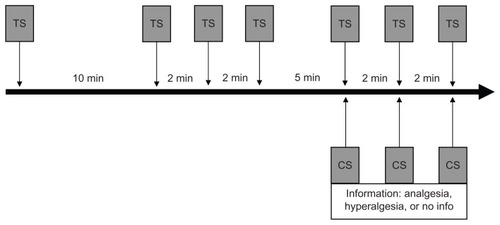
Table 1 Descriptive data for the main outcome measures for males and females in the experimental groups
Figure 2 Change in pain intensity from test stimulus alone to conditioning stimulation. Negative scores indicate a reduction in pain during conditioning stimulation. Error bars depict standard error of the mean. (A) Change in pain intensity across the experimental groups including both males and females. (B) Change in pain intensity across the experimental groups in males. (C) Change in pain intensity across the experimental groups in females.
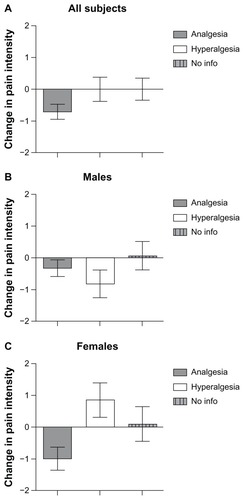
Figure 3 Change in pain intensity from test stimulus alone to conditioning stimulation as a function of order of presentation of conditioning stimulation.
Abbreviation: cs, conditioning stimulation
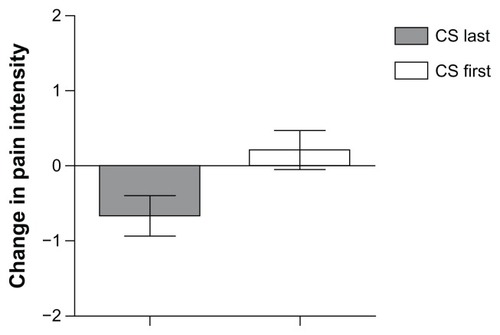
Figure 4 Change in stress from test stimulus alone to conditioning stimulation. Positive scores indicate an increase in stress. Error bars depict standard error of the mean. (A) Change in stress across the experimental groups including both males and females. (B) Change in stress across the experimental groups in males. (C) Change in stress across the experimental groups in females.
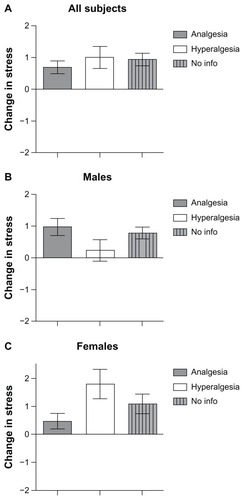
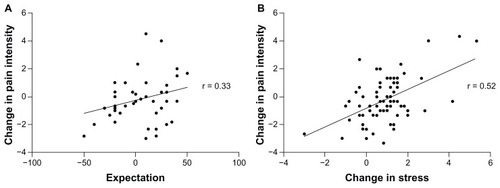
Figure 5 (A) Relationship of expectation to the effect of conditioning stimulation on pain intensity. Only subjects in the analgesia and hyperalgesia groups were asked about expectations (n = 46). (B) Relationship of change in stress to the effect of conditioning stimulation on pain intensity (n = 70).