
Figures & data

Figure 1 Flow diagram of MUSIQOLS study.
Abbreviations: ACC, Acute Care Clinic; ASCQ-Me, Adult Sickle Cell Quality of Life Measurement System; CSQ-SCD, Coping Skills Questionnaire for Sickle Cell Disease; MT, music therapy; PROMIS-29, Patient Reported Outcomes Measurement Information System – 29; REDCap, Research Electronic Data Capture; SCD, sickle cell disease; SCSES, Sickle Cell Self-Efficacy Scale; WLC, waitlist control.
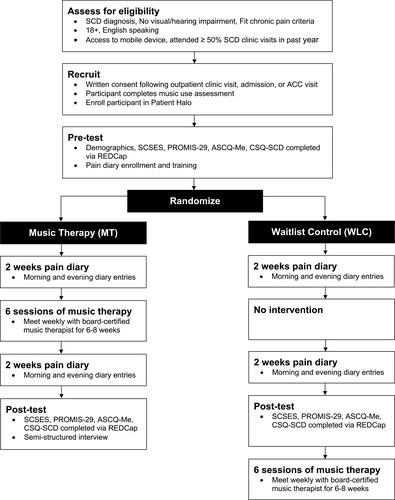
Figure 2 Outcome measures utilized in MUSIQOLS.
Abbreviations: ACC, Acute Care Clinic; CSQ-SCD, Coping Skills Questionnaire for Sickle Cell Disease; ED, emergency department; MT, music therapy; MUSIQOLS, MUSic therapy to Improve Quality Of Life in Sickle cell disease; OARRS, Ohio Automated Rx Reporting System; PROMIS-29, Patient Reported Outcomes Measurement Information System – 29; SCD, sickle cell disease; SCSES, Sickle Cell Self-Efficacy Scale.
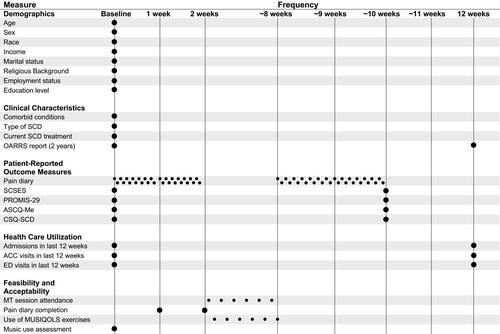
Table 1 Demographic Characteristics of the Study Participants
Table 2 Clinical Characteristics of the Study Participants
Table 3 Daily Pain Scores of the Study Participants
Figure 3 Participant flow chart.
Abbreviations: MT, music therapy; WLC, waitlist control.
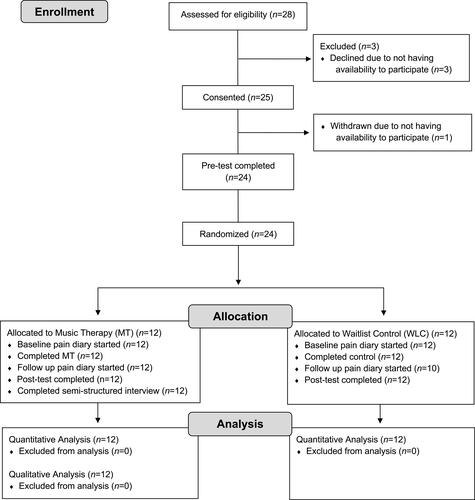
Table 4 Themes and Representative Quotes from Music Therapy Participants
Table 5 Self-Efficacy and Quality of Life Scores of the Study Participants