Figures & data
Figure 1 Study design.
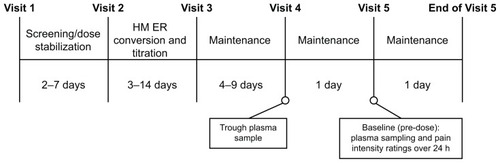
Figure 2 Patient disposition.
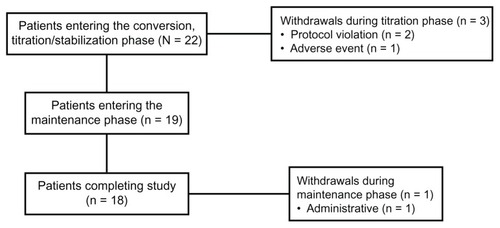
Table 1 Baseline demographics and characteristics
Table 2 Concomitant medication use
Figure 3 Distribution of OROS® hydromorphone extended-release (ER) doses at the start and end of the titration phase.
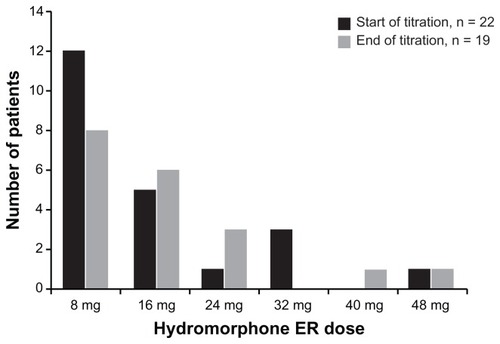
Figure 4 Mean (standard deviation) dose-normalized (to 16 mg dose) hydromorphone plasma concentration–time profile following the administration of OROS® hydromorphone extended-release (n = 17).
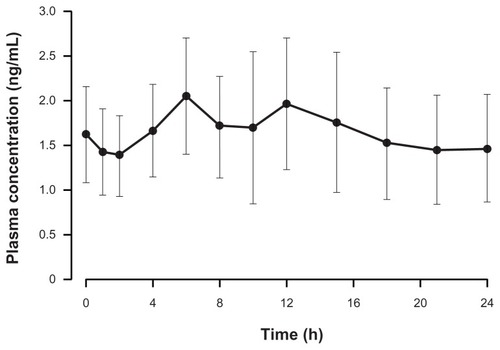
Figure 5 Relationship between hydromorphone area under the concentration–time curve from 0–24 hours (AUC0–24) and dose of OROS® hydromorphone extended-release (ER).
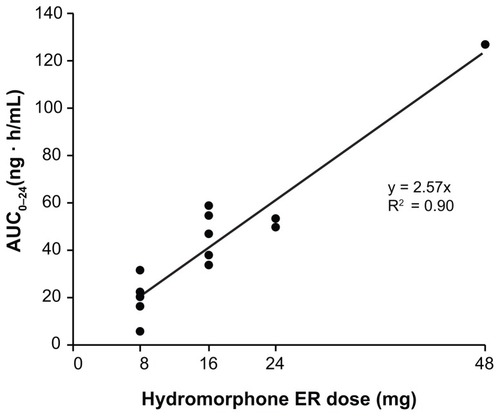
Figure 6 Percentage of patients with plasma concentrations ≥ 50% maximum plasma concentration at each time point after dosing with OROS® hydromorphone extended-release (n = 14).
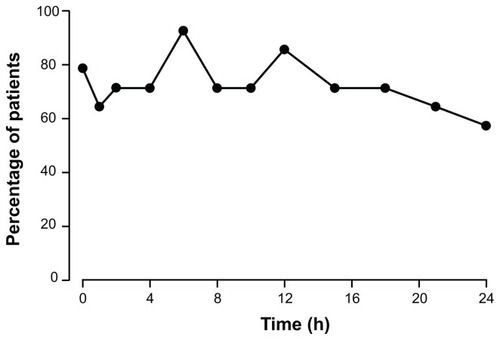
Figure 7 Mean (standard error of the mean) pain intensity difference (PID) scores over 24 hours at Visit 5 (n = 17).
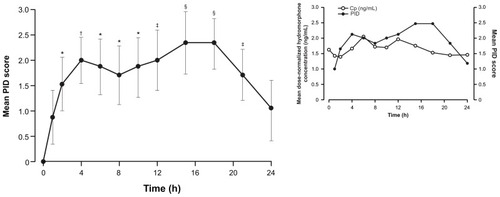
Table 3 Adverse events (AEs) reported by ≥5% of patients, by relationship to study drug